

Ethanol–water P–xy diagram: a worked modified Raoult’s law example
At 343.15 K, when does an equimolar ethanol–water liquid start to boil, and what is in the first vapour? Follow one live ChETL calculation from setup to its equations, diagram and interpretation.
- Mixture
- Ethanol (1) / water (2)
- Temperature
- 343.15 K (70 °C)
- Liquid composition
- x₁ = x₂ = 0.5
- Model
- Modified Raoult · NRTL
- Bubble pressure
- 0.6791 bar
- First vapour
- y₁ = 0.6626
The first bubble is richer in ethanol than the liquid. Its composition is not the amount vaporised. These are model predictions, independently reproduced from the stated parameters.
Specify the liquid; find its first vapour.
Open Phase Equilibrium → P–xy. Choose ETHANOL and WATER, Modified Raoult, NRTL and Library parameters; select Bubble, set 343.15 K and x₁ = 0.5, then Calculate.
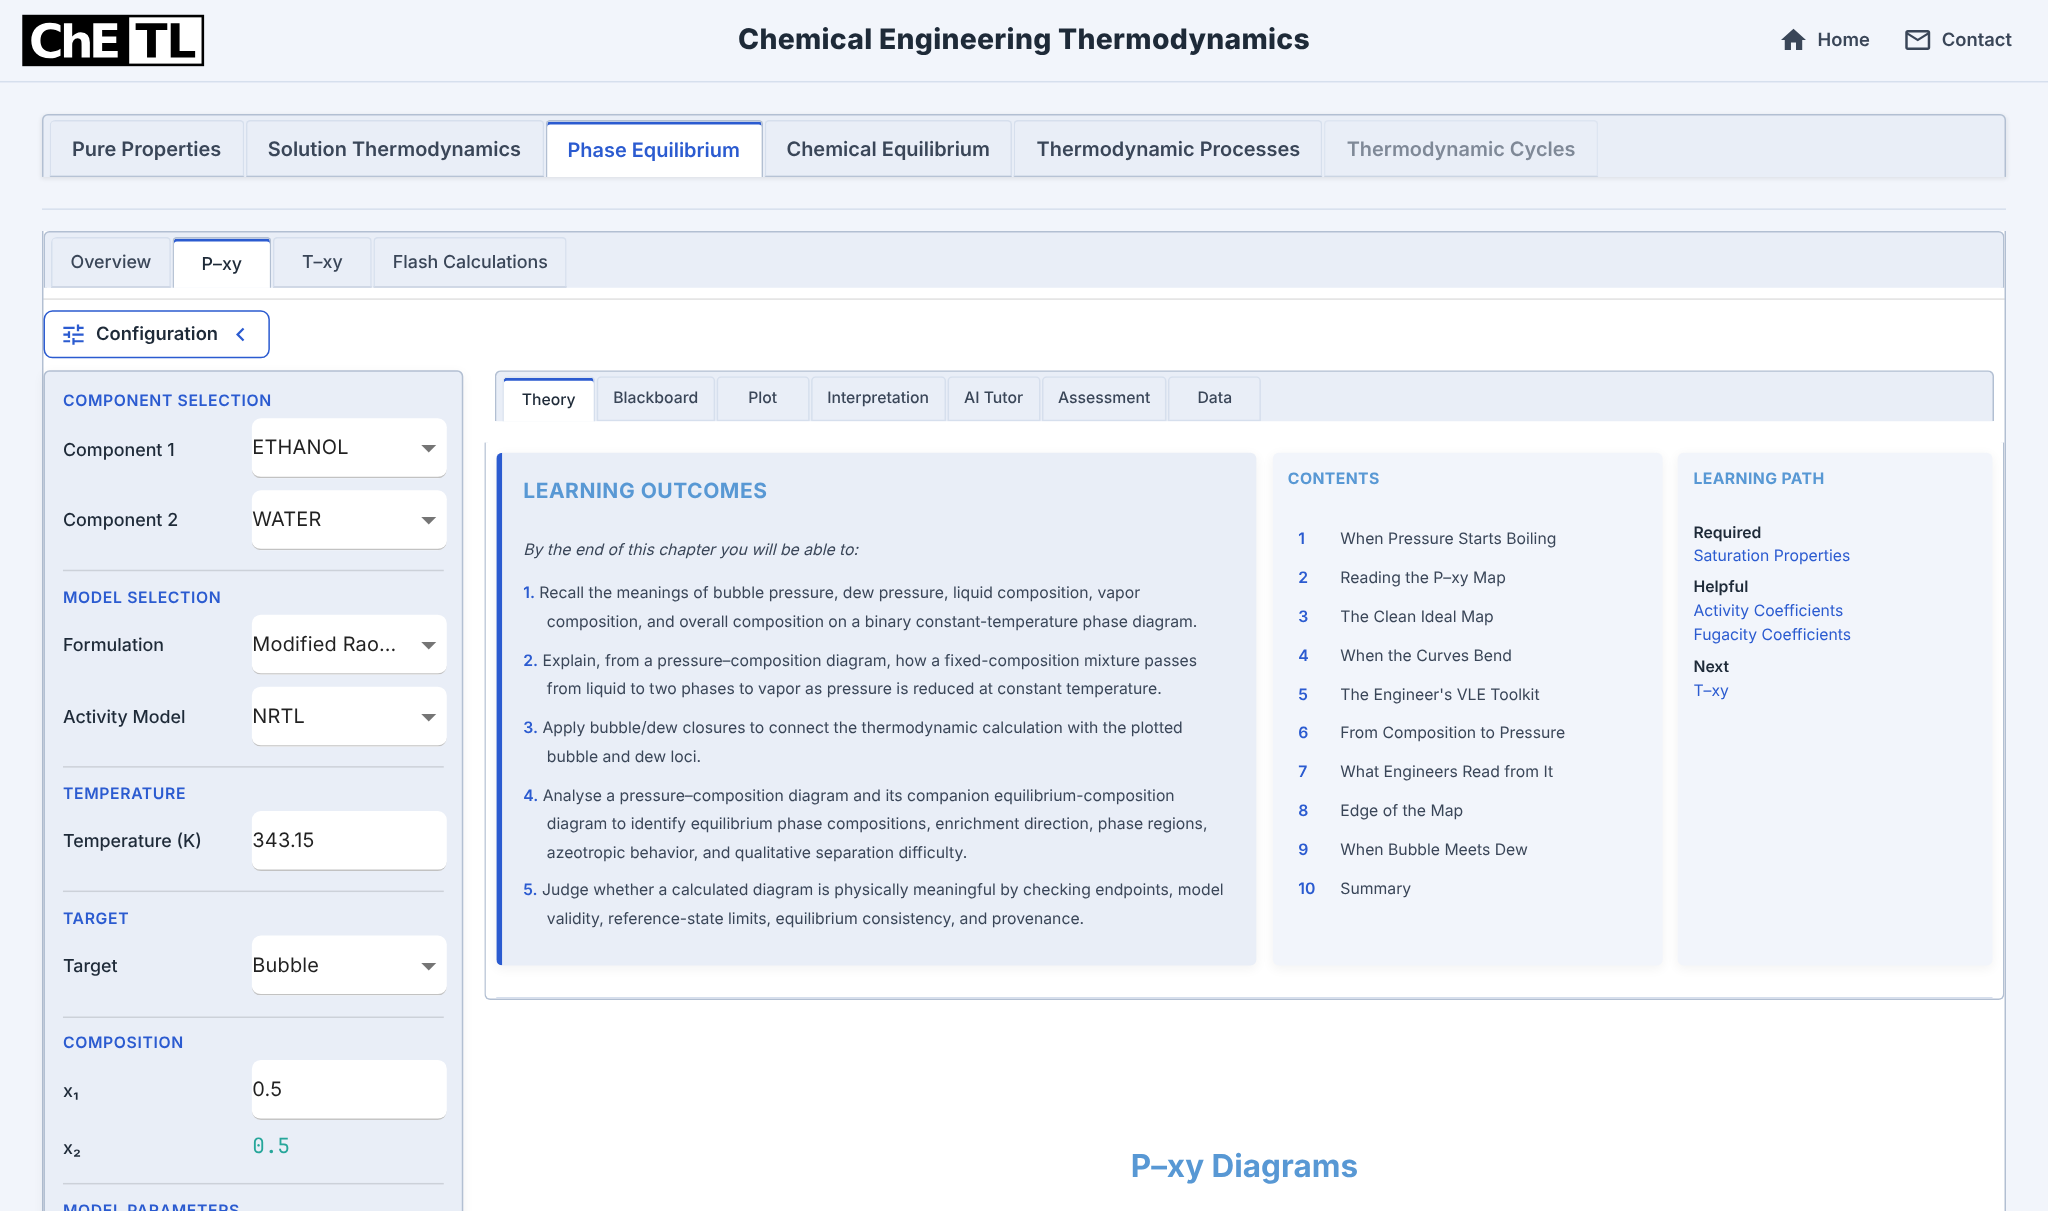
The known quantities are temperature and liquid composition. The unknowns are bubble pressure and the composition of the incipient vapour. The parameter values and their sources are available below.
Connect boiling to the calculation route.
The Theory tab explains how pressure changes phase behaviour. Its solution strategy then separates the bubble and dew problems.
What the phase boundary means
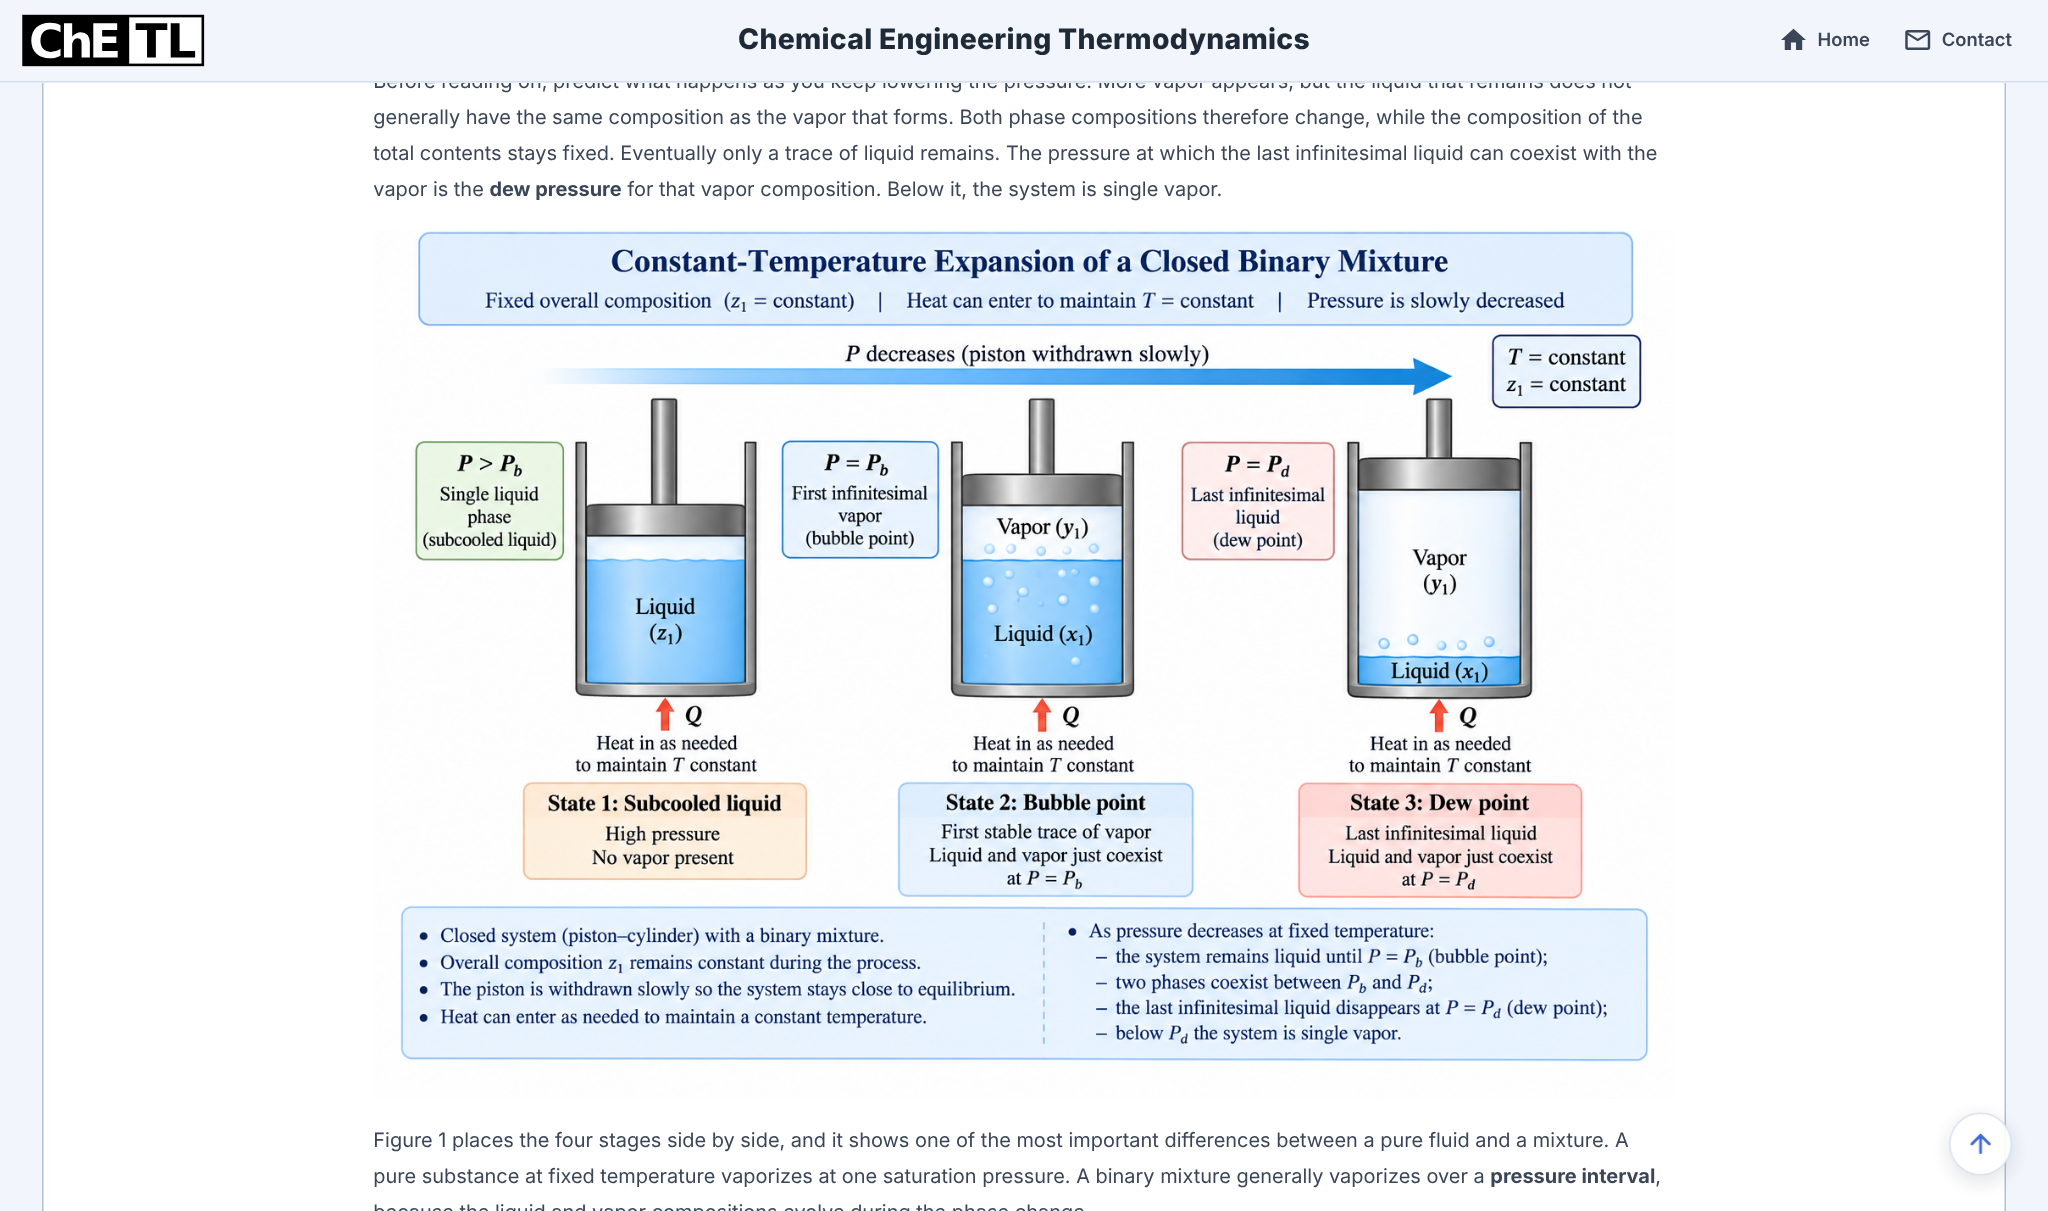
At fixed temperature, reducing pressure eventually produces the first stable vapour bubble. Liquid and vapour generally have different compositions.
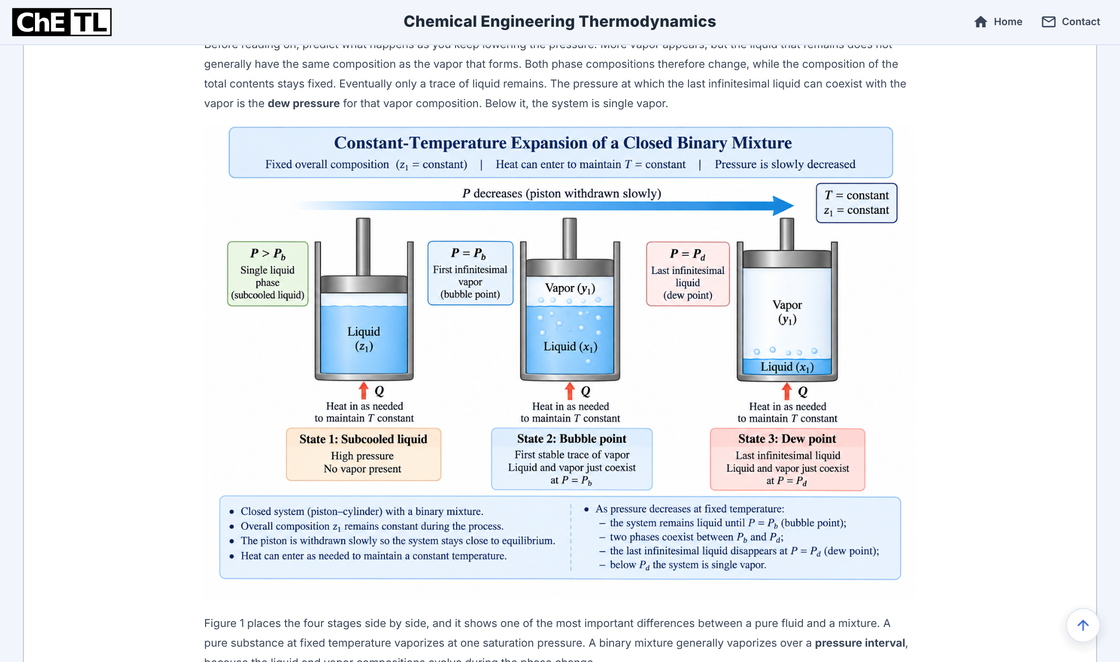
Theory tab: the physical picture before the equations. Choose the modified Raoult bubble route
Here the liquid composition is known: calculate saturation pressures and NRTL activity coefficients, sum the component contributions to pressure, then obtain the vapour composition directly.
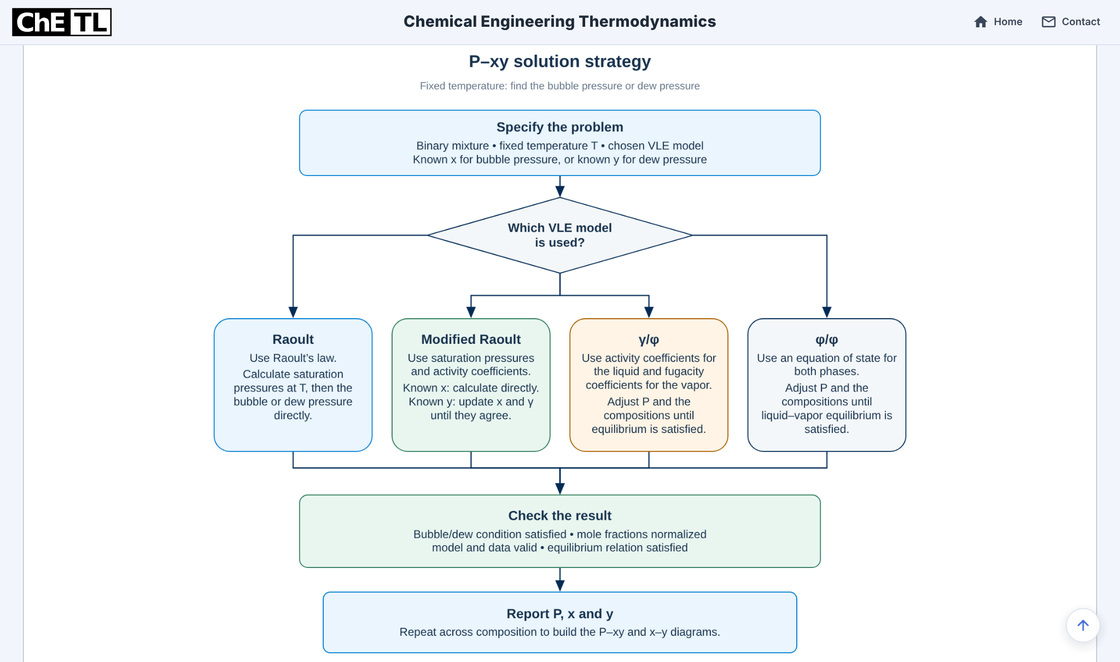
The solution strategy as displayed in the platform; no added annotation.
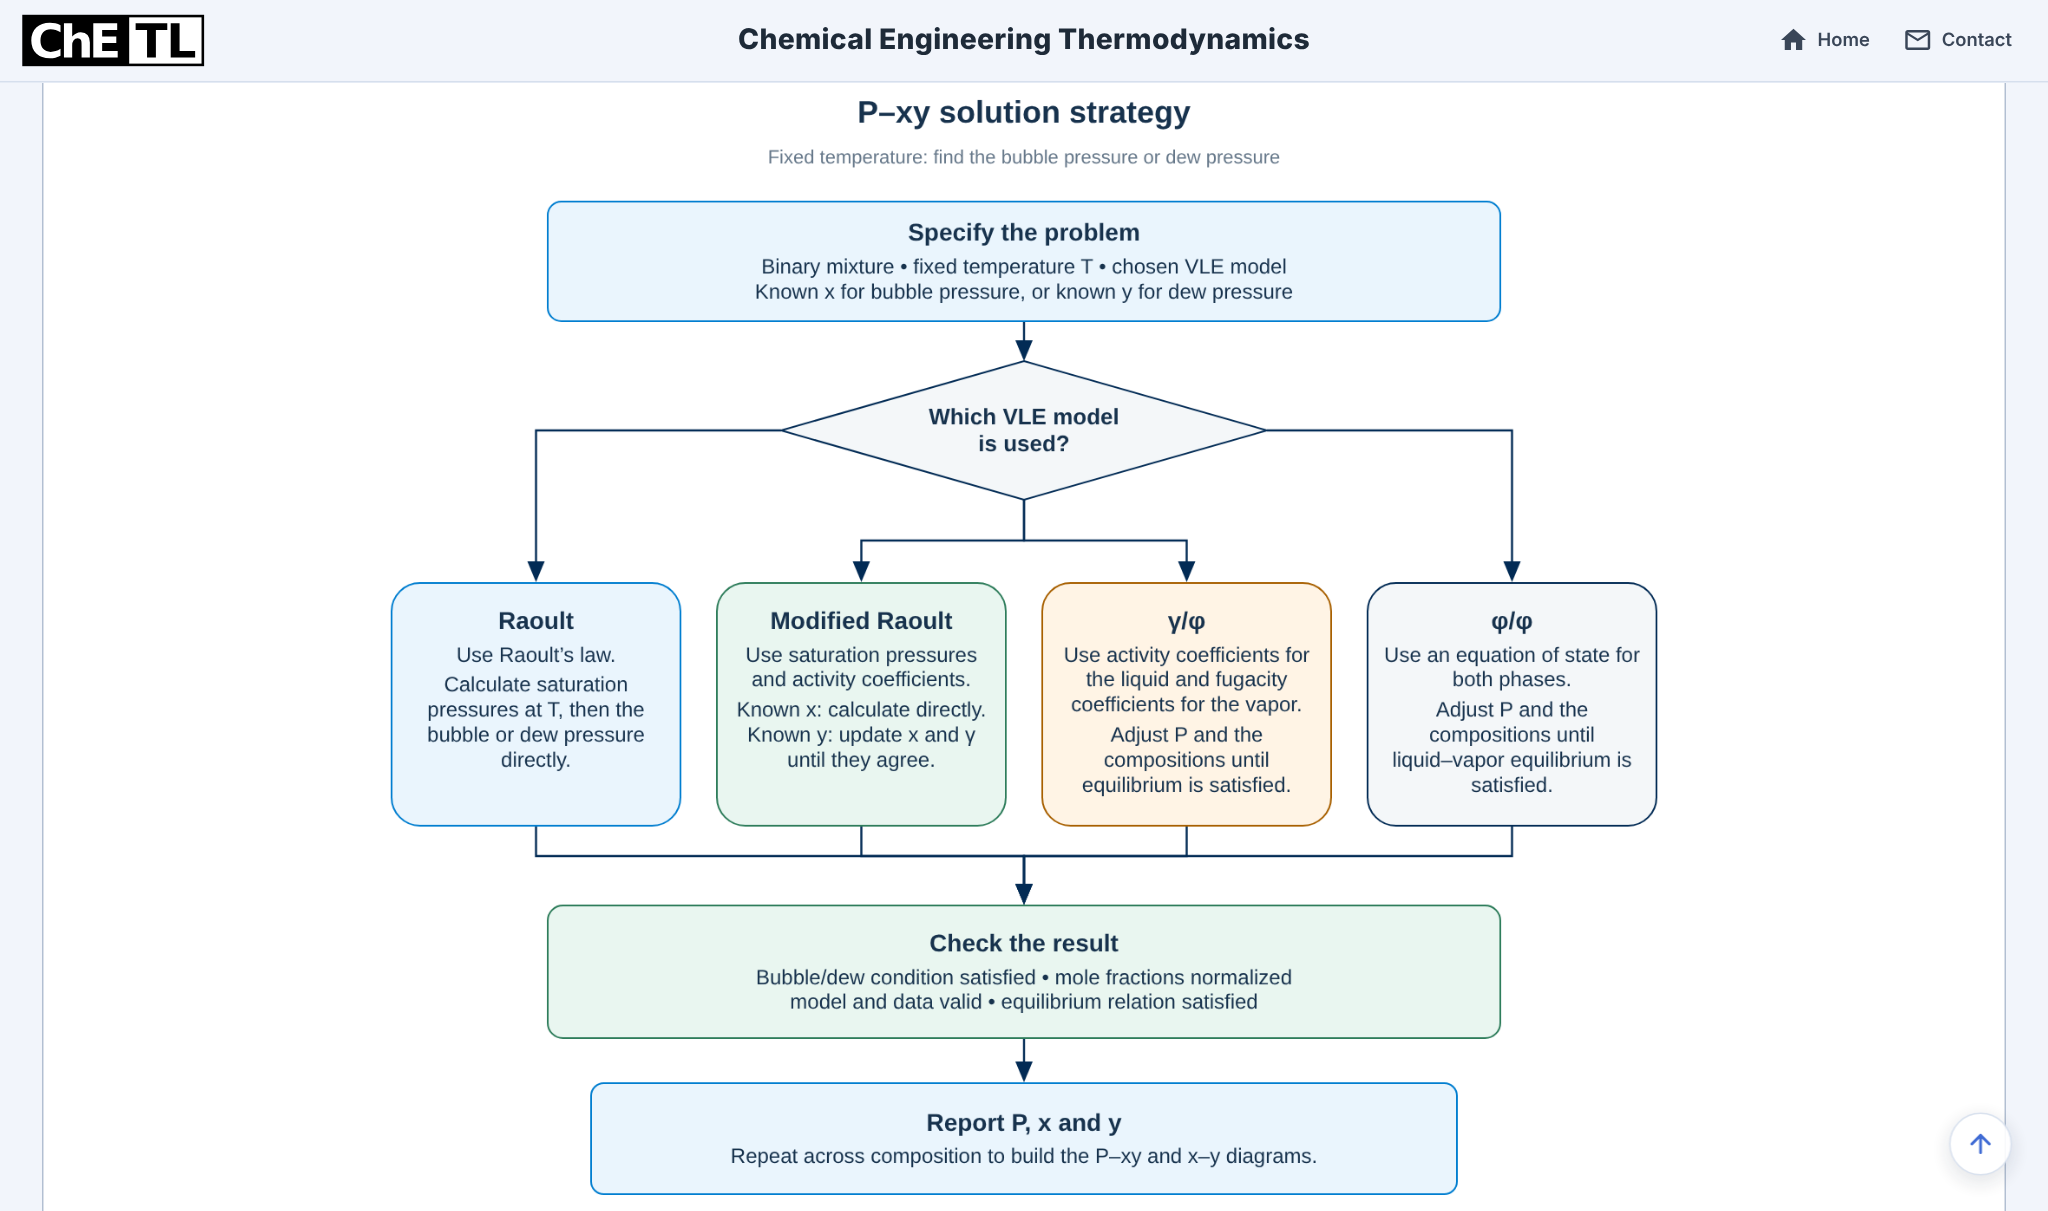
The relations used in this case are:
yiP = xiγiPisat
P = ΣixiγiPisat
Ki = γiPisat / P
yi = xiKi
Read the actual Blackboard trace.
Four successive views show the whole trace of one solved state; each starts where the last left off. The equations and substitutions come from the running platform.
Inputs, parameters and assumptions
The trace records the configured liquid, NRTL Library coefficients and their valid temperature range. The vapour is an ideal gas; the liquid is non-ideal.
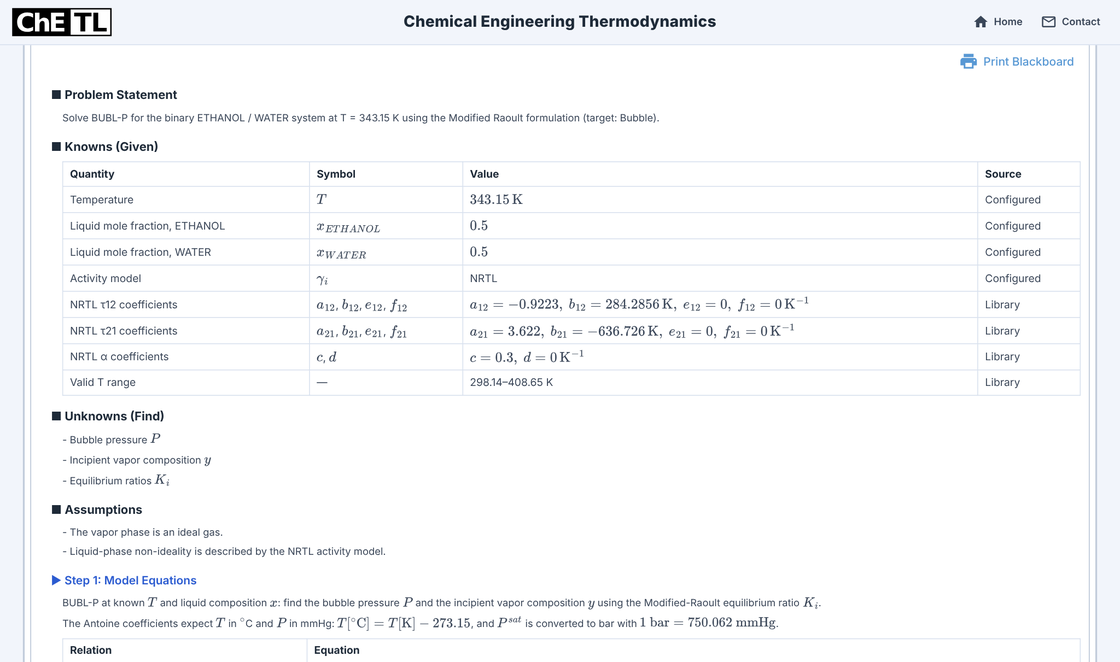
Blackboard: problem, knowns, parameter provenance and assumptions. The model equations
Modified Raoult’s law combines pure-component saturation pressures with liquid activity coefficients. Normalising the first vapour gives the bubble-pressure closure. The Antoine constants listed below use temperature in °C and saturation pressure in mmHg.
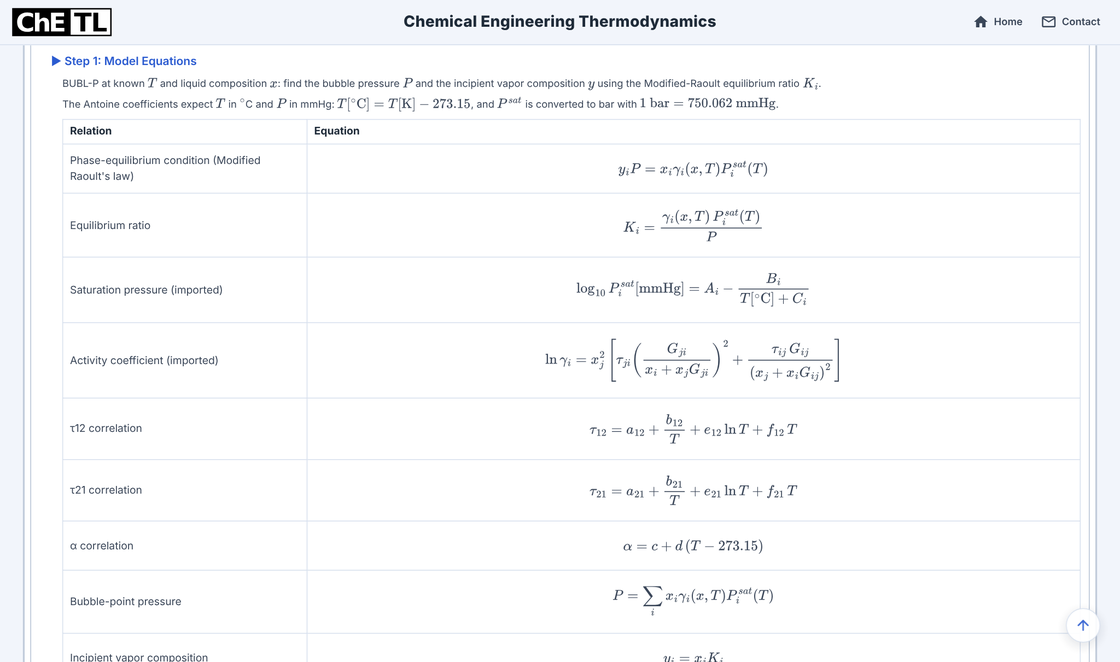
Blackboard: Step 1 model equations before substitution. From properties to pressure and composition
At 343.15 K, γ₁ = 1.245 and γ₂ = 1.474. Their weighted saturation-pressure contributions give P = 0.6791 bar, and the equilibrium ratios follow. The NRTL activity-coefficient example shows how these γ values are obtained.
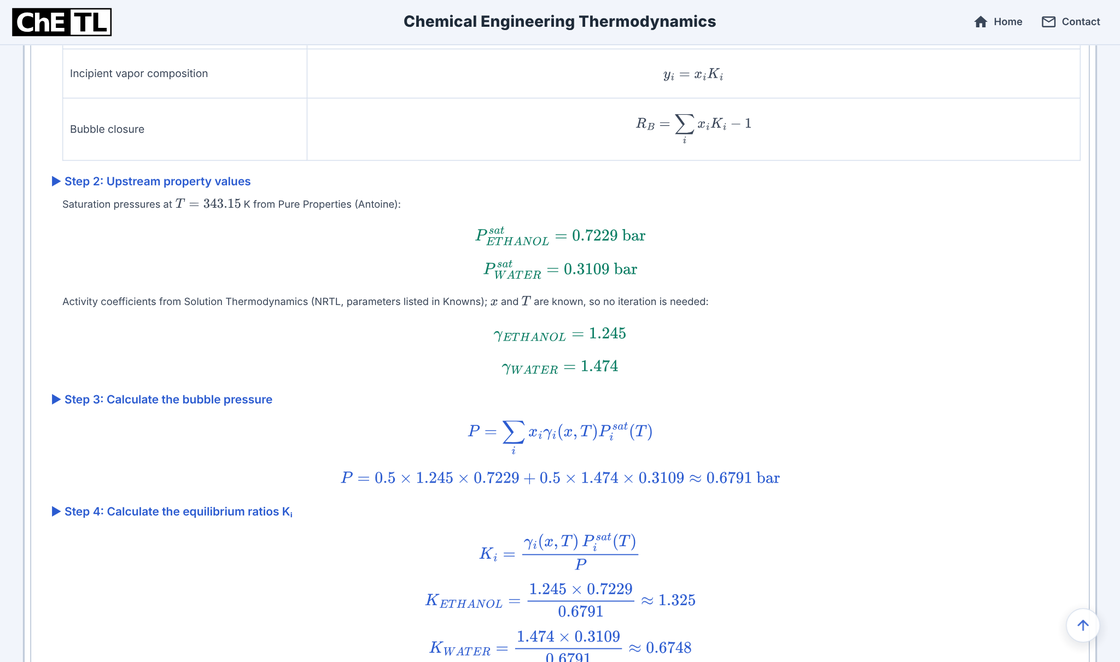
Blackboard: Steps 2–4, property values → bubble pressure → equilibrium ratios. Check the solved state
y₁ = 0.6626, y₂ = 0.3374; K₁ = 1.325 and K₂ = 0.6748. The phase compositions sum to one and satisfy ΣxiKi = 1.
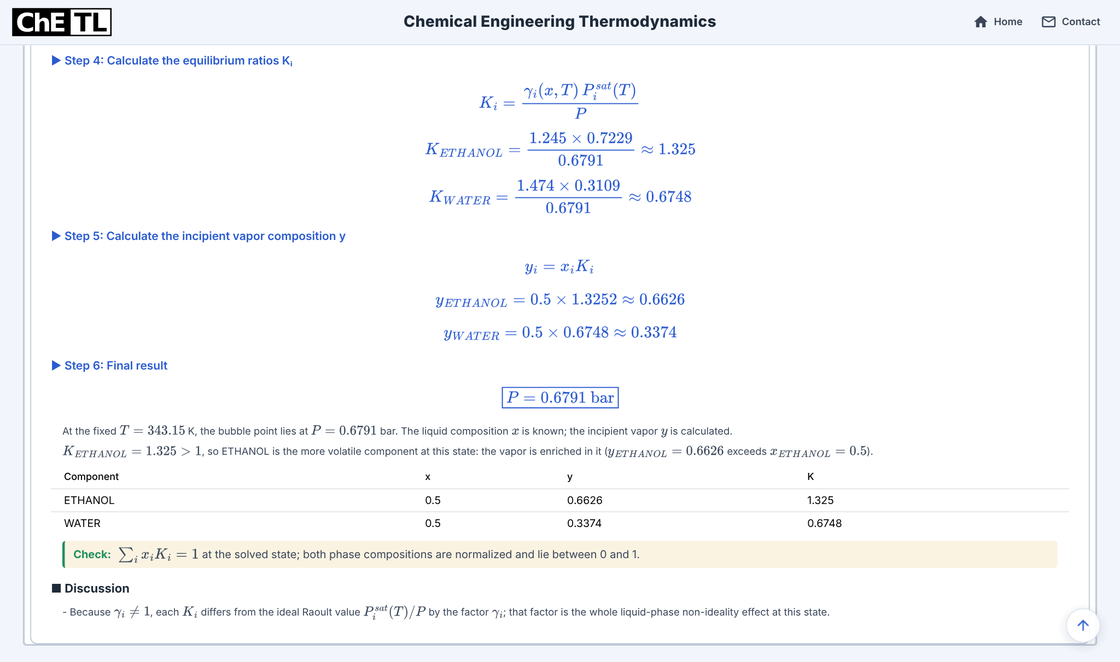
Blackboard: Steps 4–6, vapour composition, final result and consistency check.
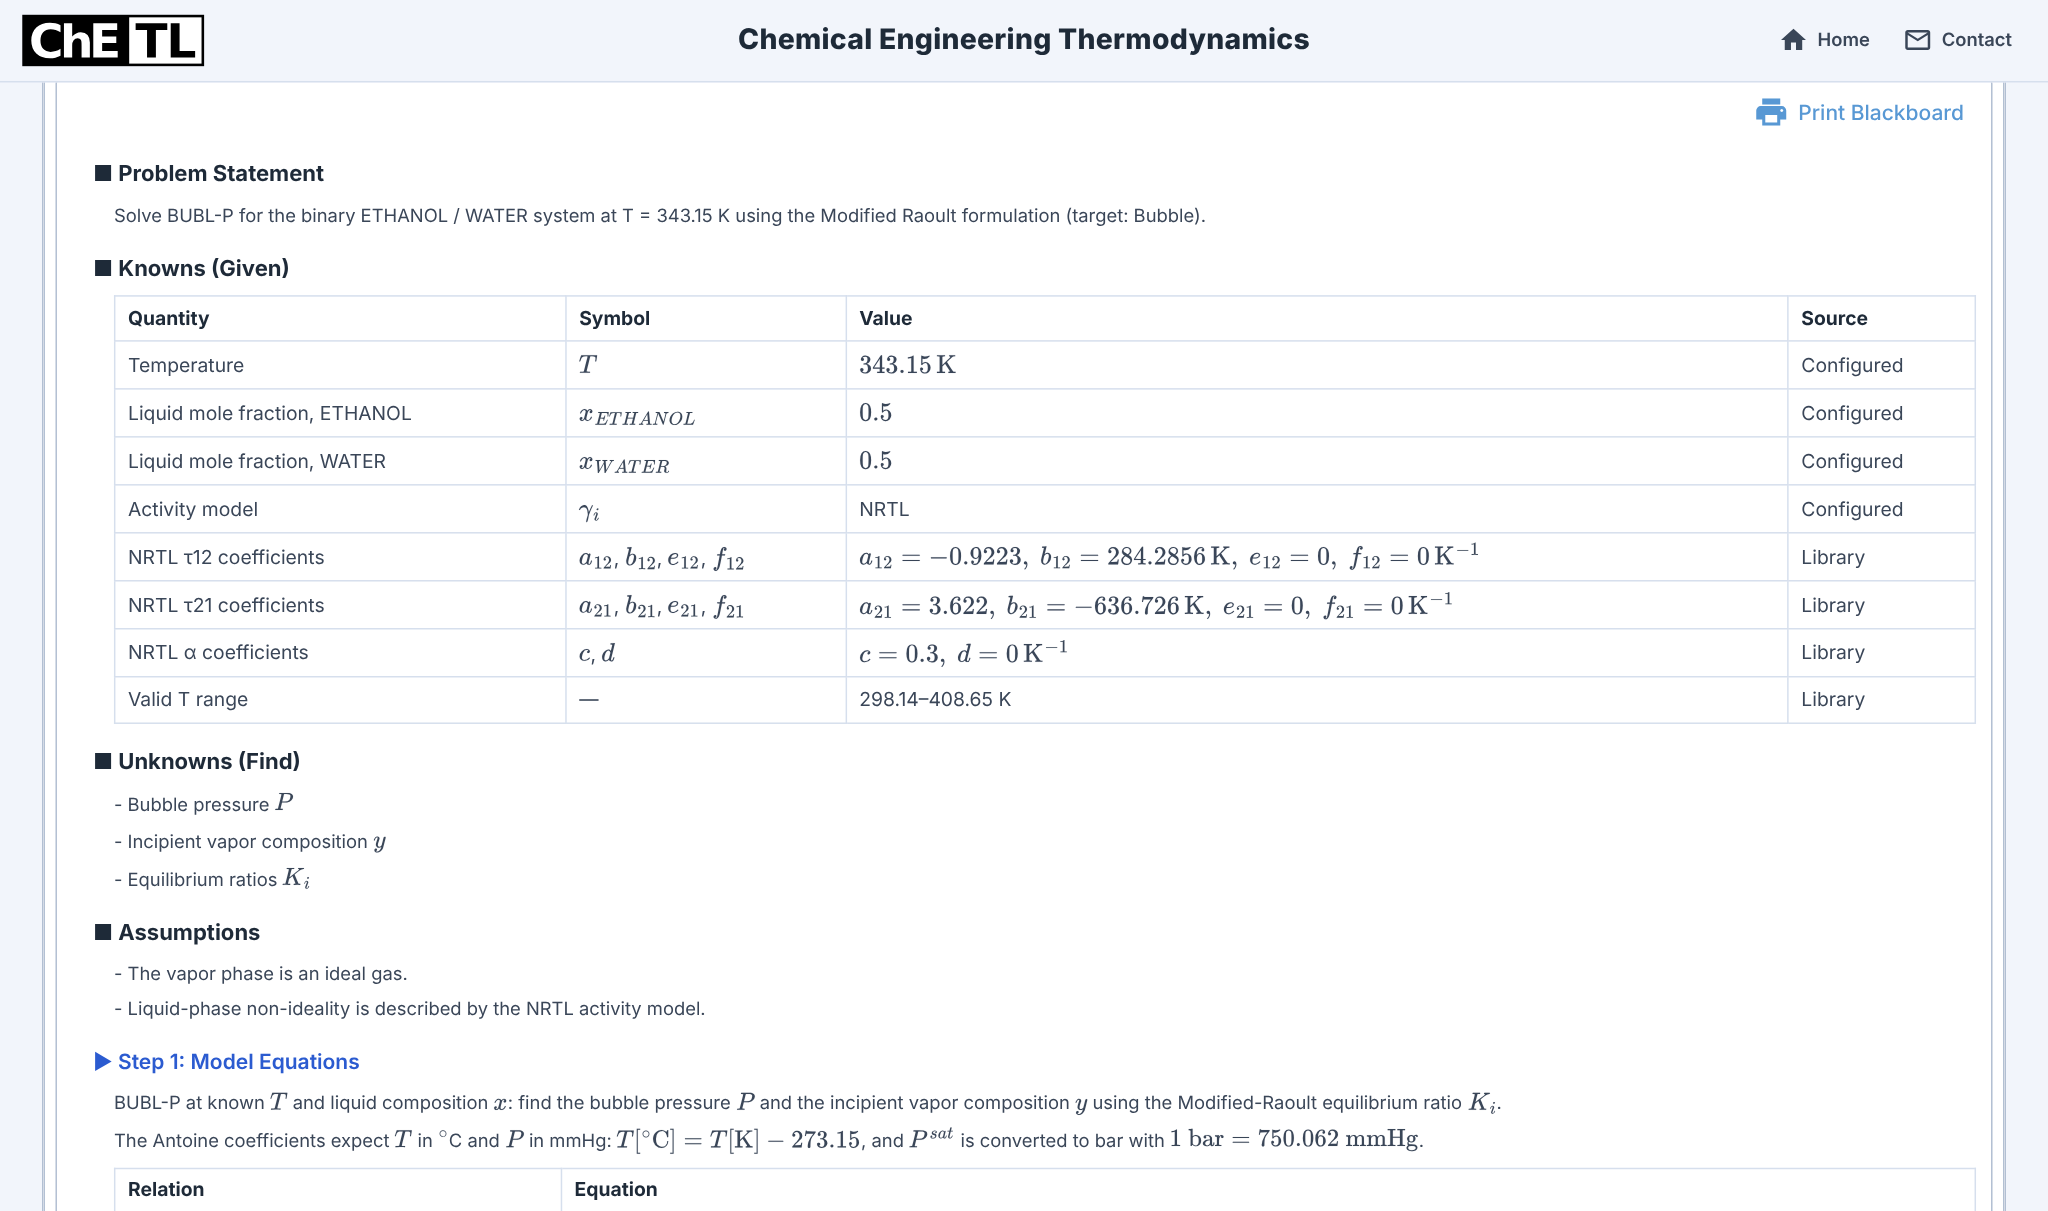
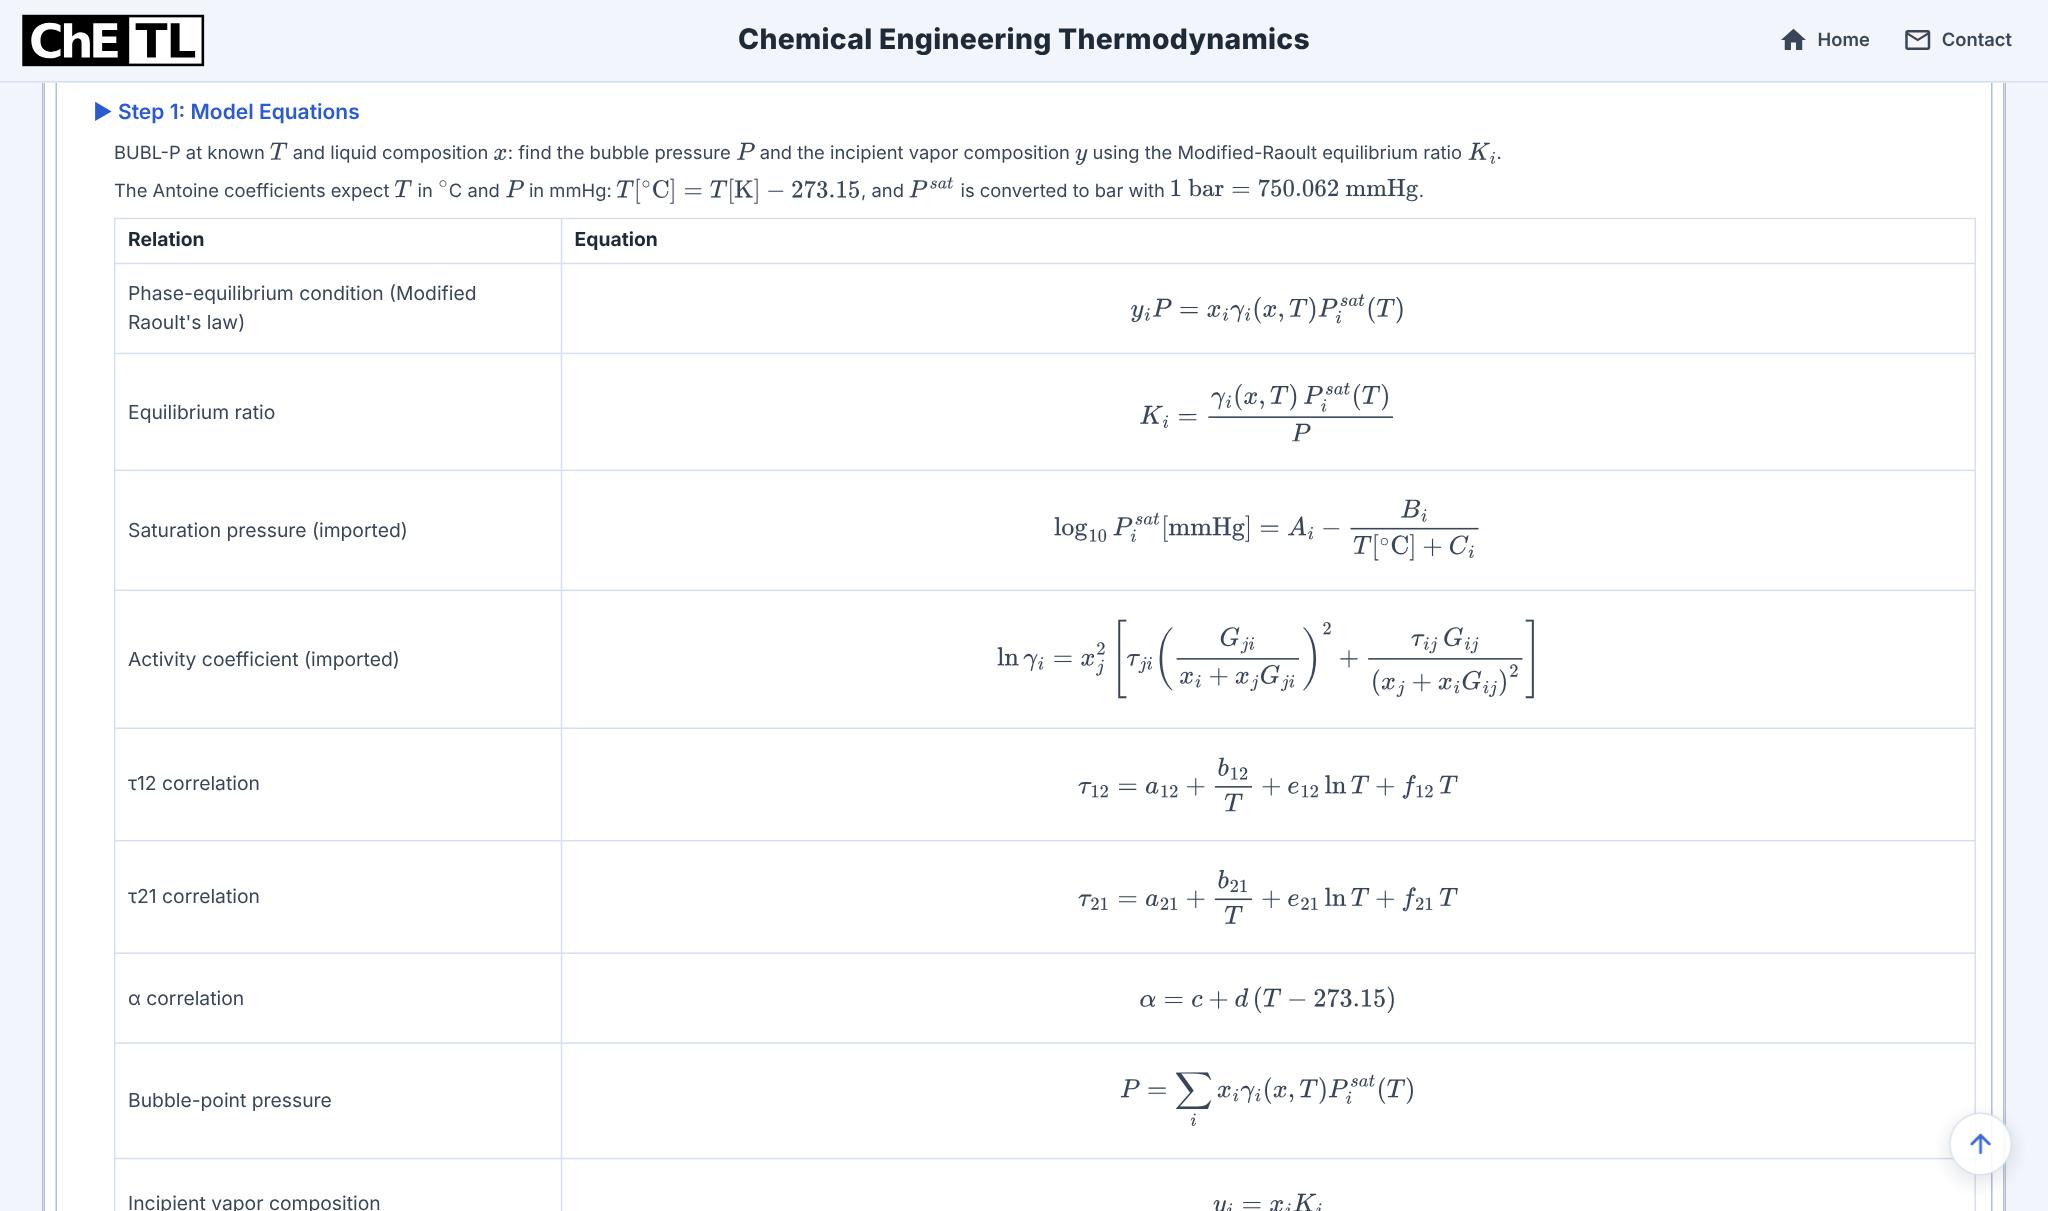
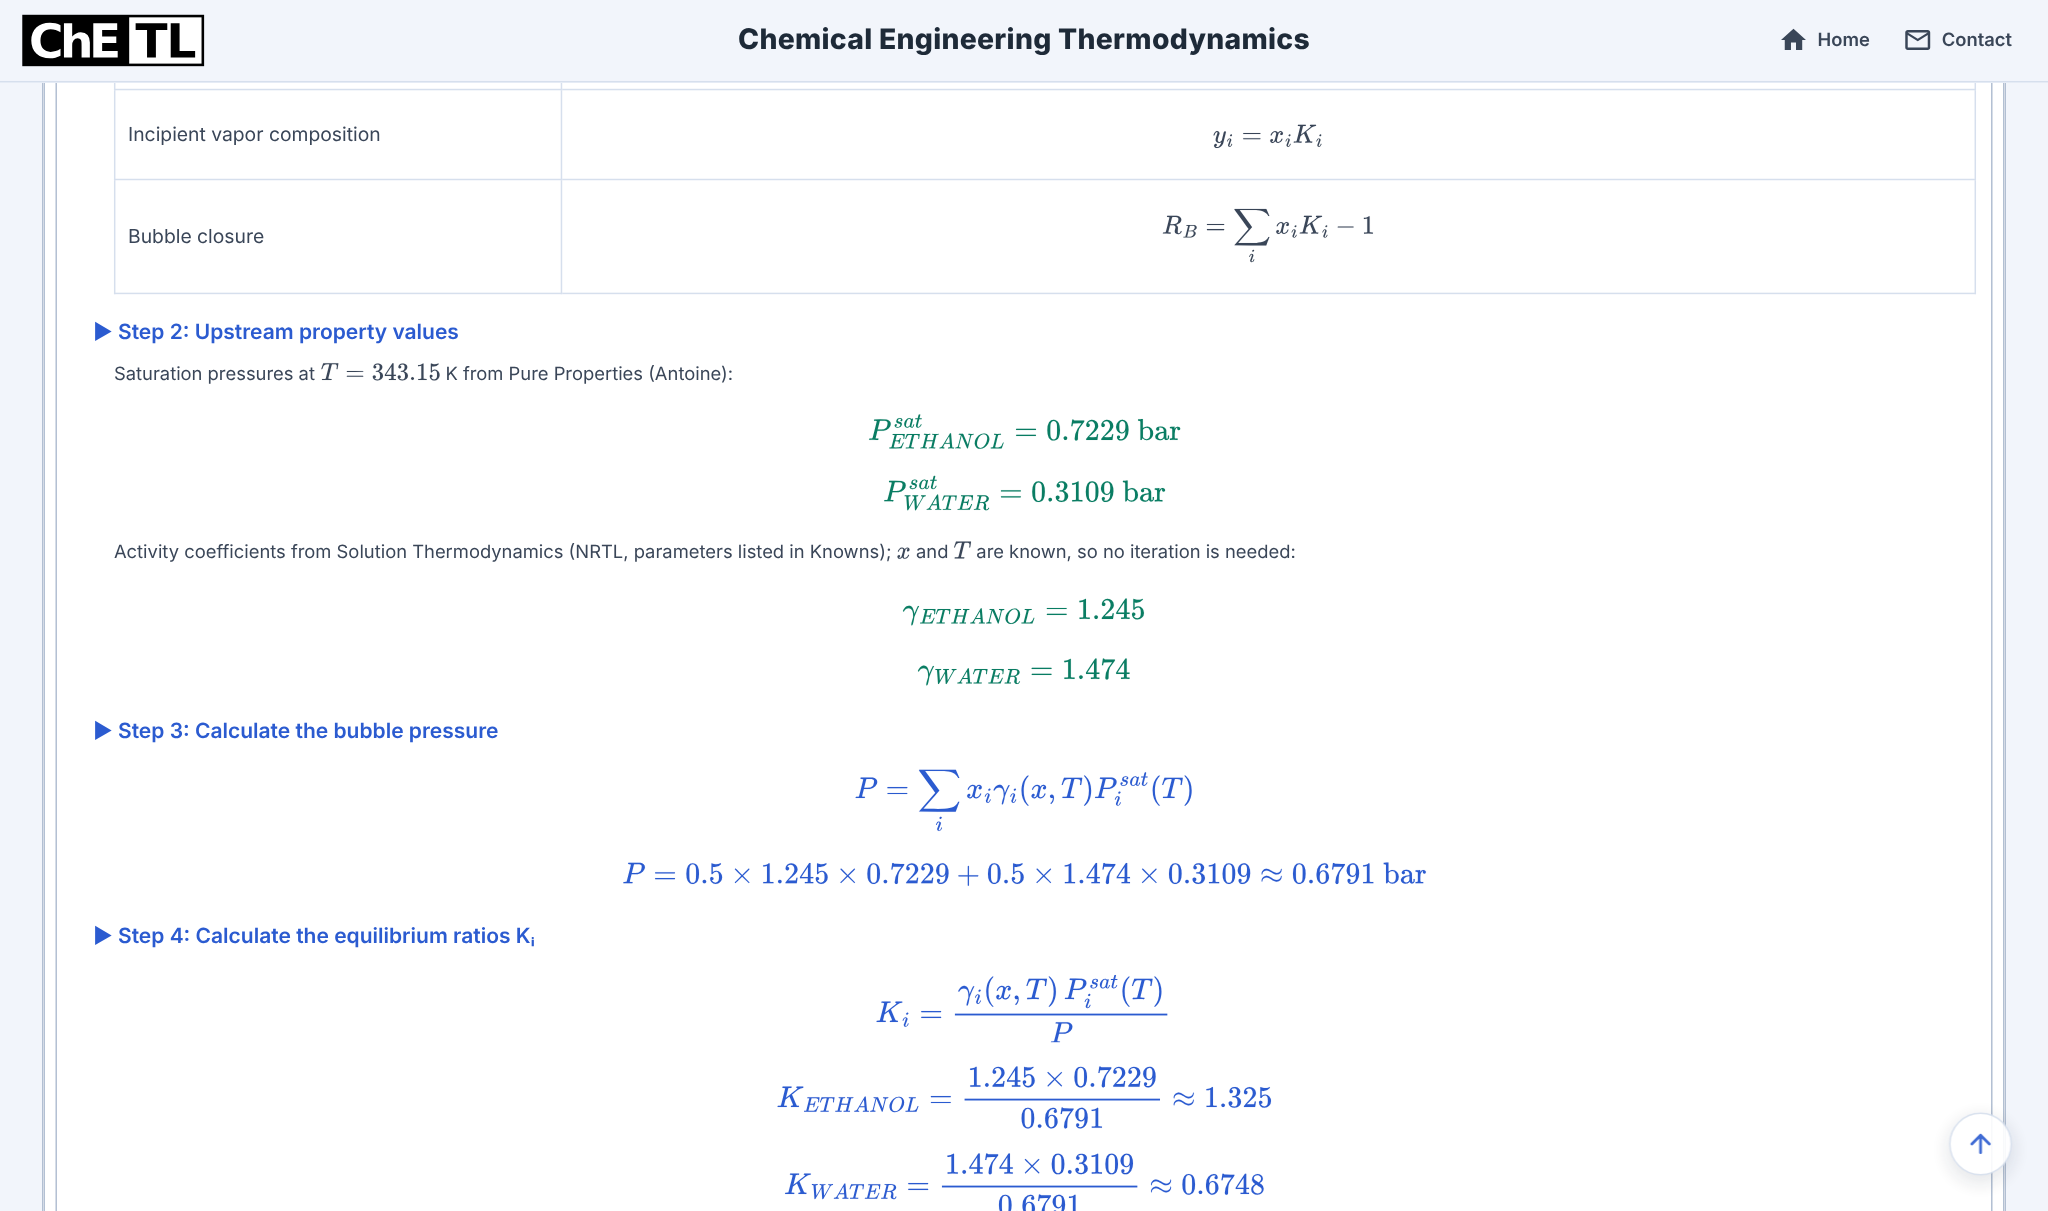
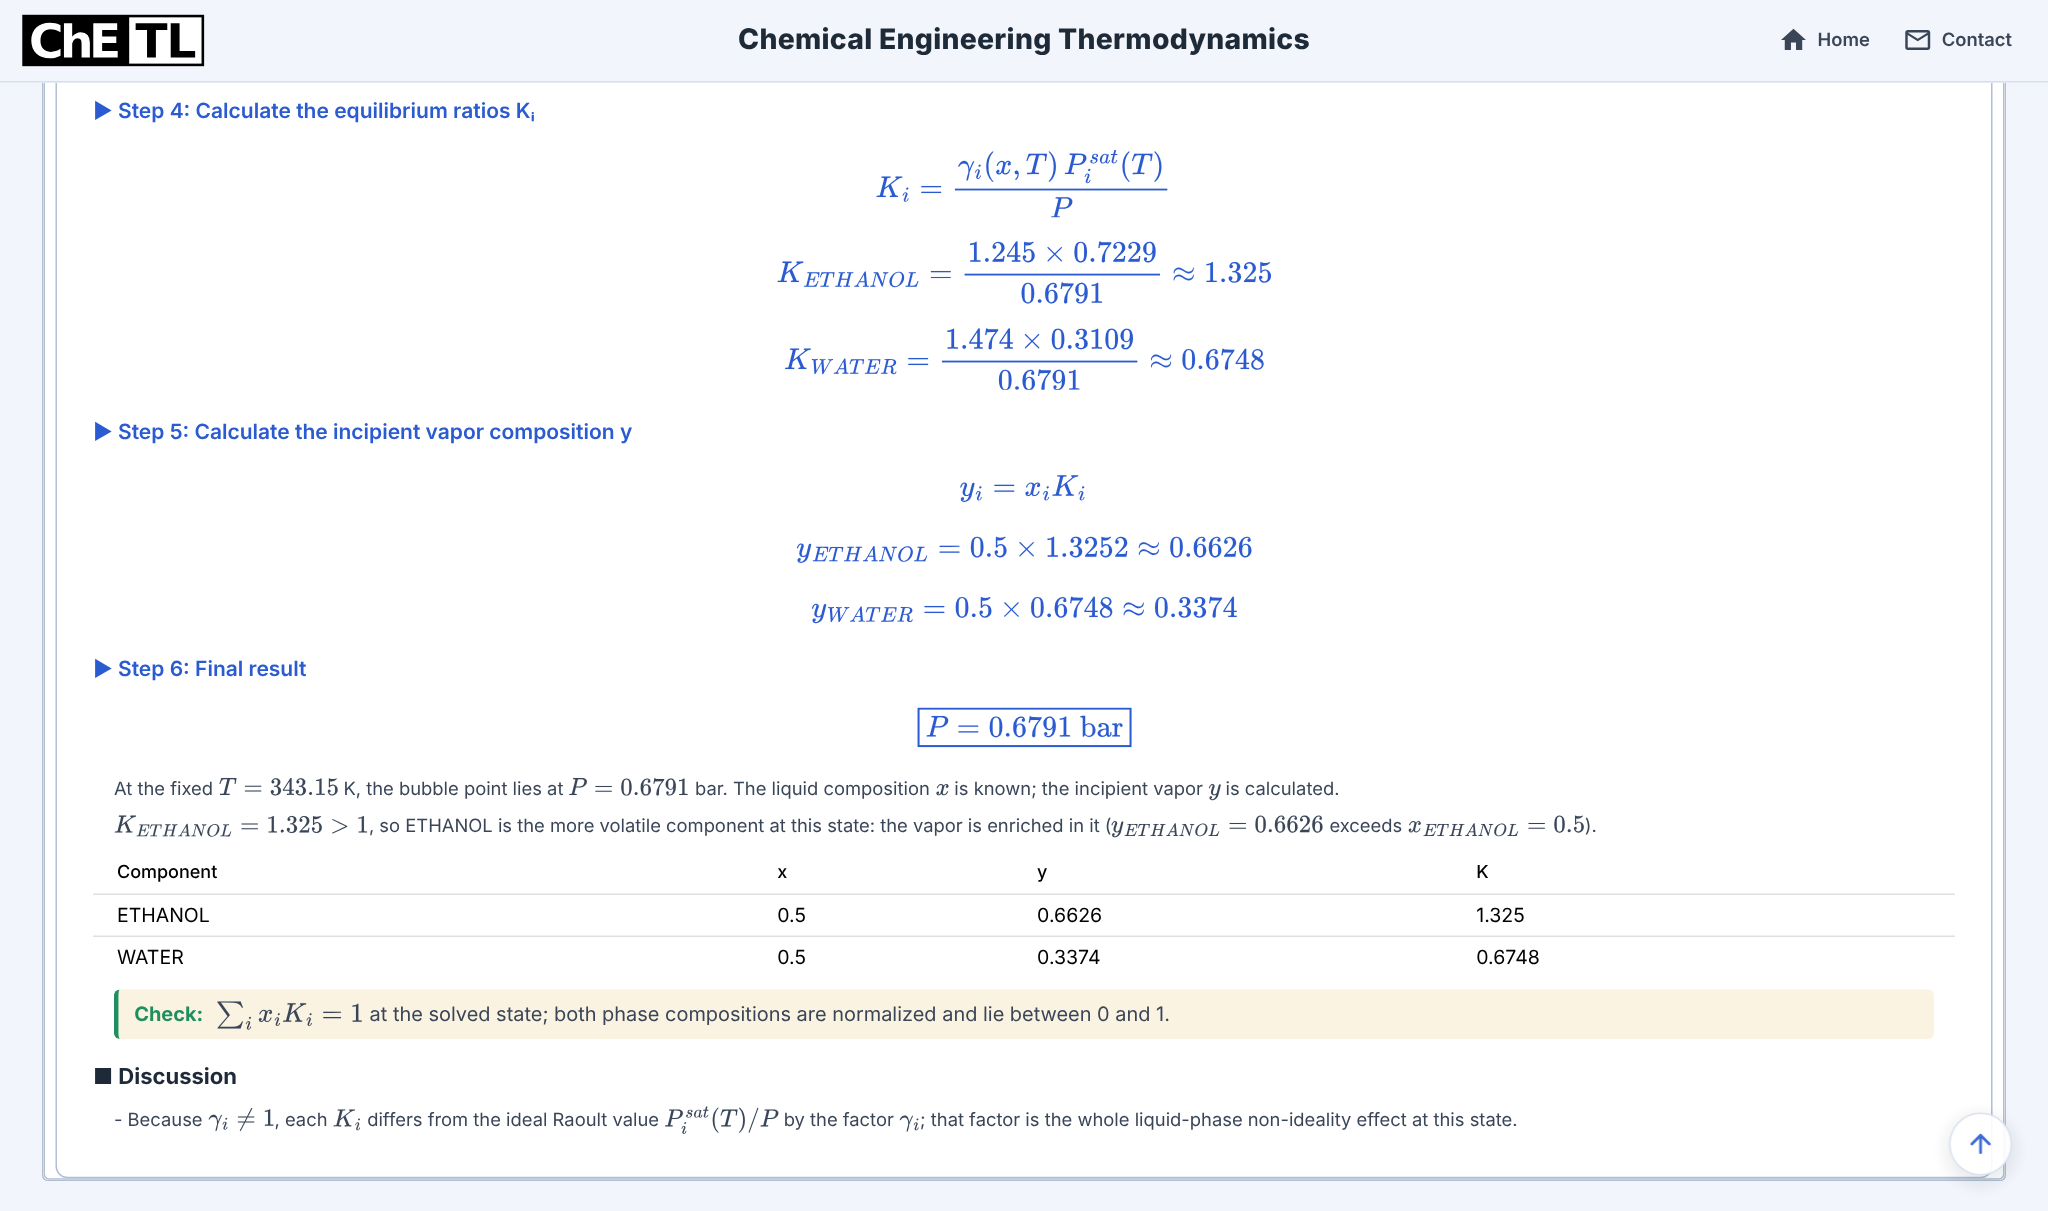
The configured temperature is 343.15 K. These captures display it as 343.15 K throughout. Displayed calculation values are rounded, so recomputing from them can differ in the last digit.
Locate the result on both plots.
Read the pressure–composition diagram and its companion composition plot from the same calculation.
A horizontal tie line joins the phases
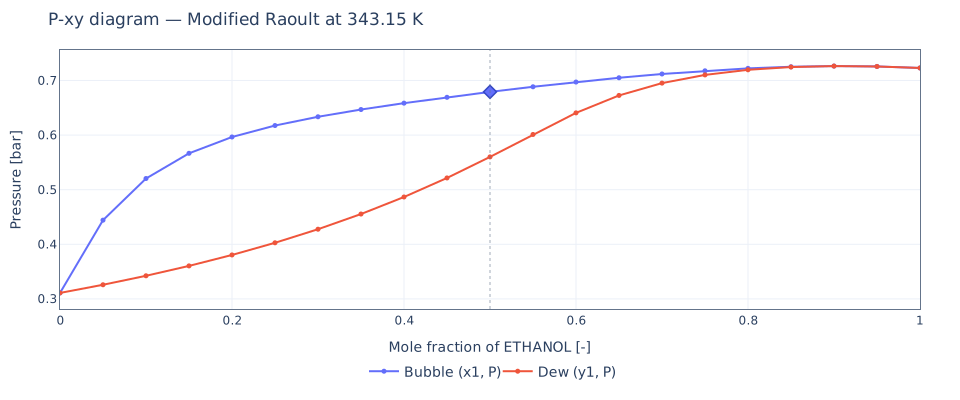
At 0.6791 bar, the bubble point at liquid x₁ = 0.5 is paired with vapour y₁ = 0.6626. Above the bubble boundary the mixture is liquid; between the boundaries it has two phases.
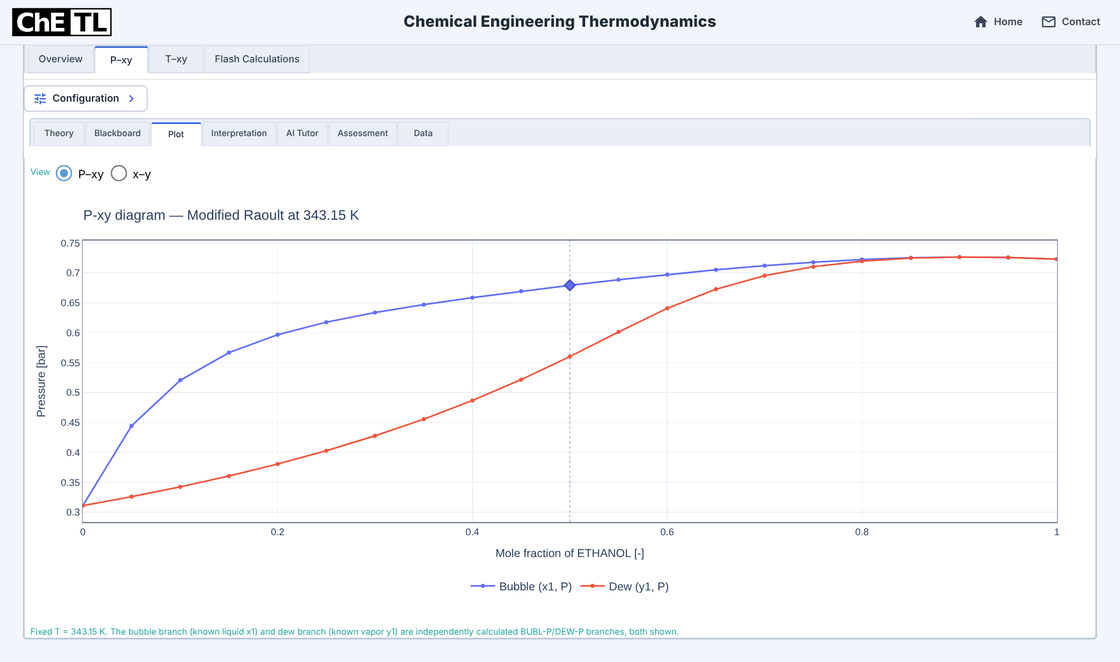
Plot tab: pressure against liquid and vapour mole fractions. Compare the phase compositions directly
For this state, the paired point lies above the diagonal: the first vapour is richer in ethanol. Each point on this fixed-temperature locus is at its own equilibrium pressure.
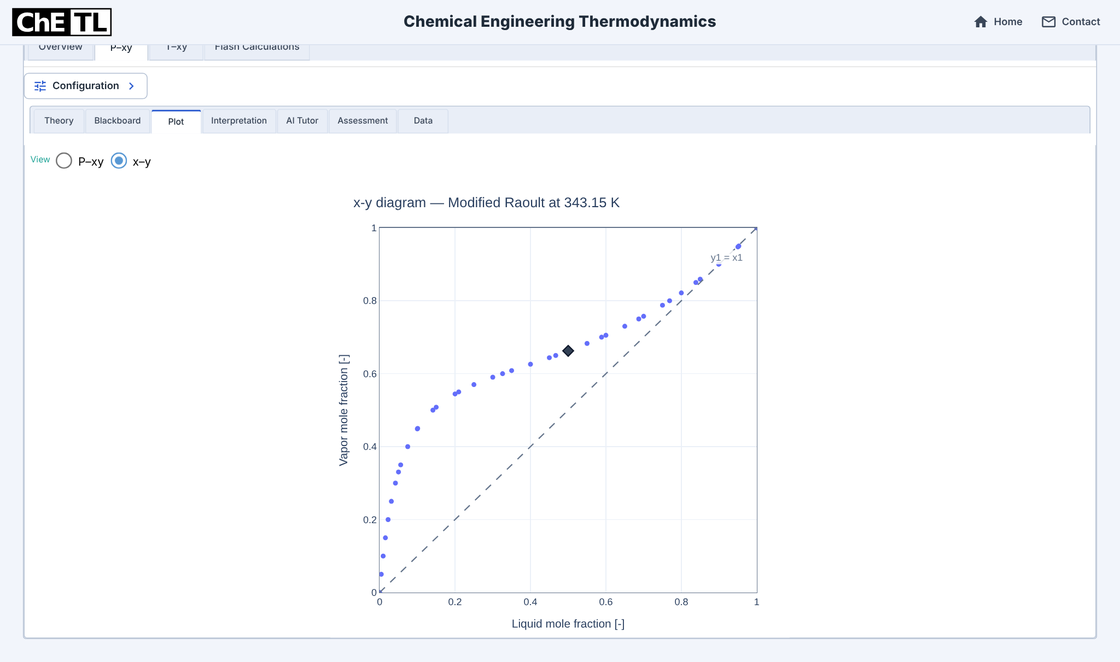
Plot tab: equilibrium compositions, not a constant-pressure column design curve.
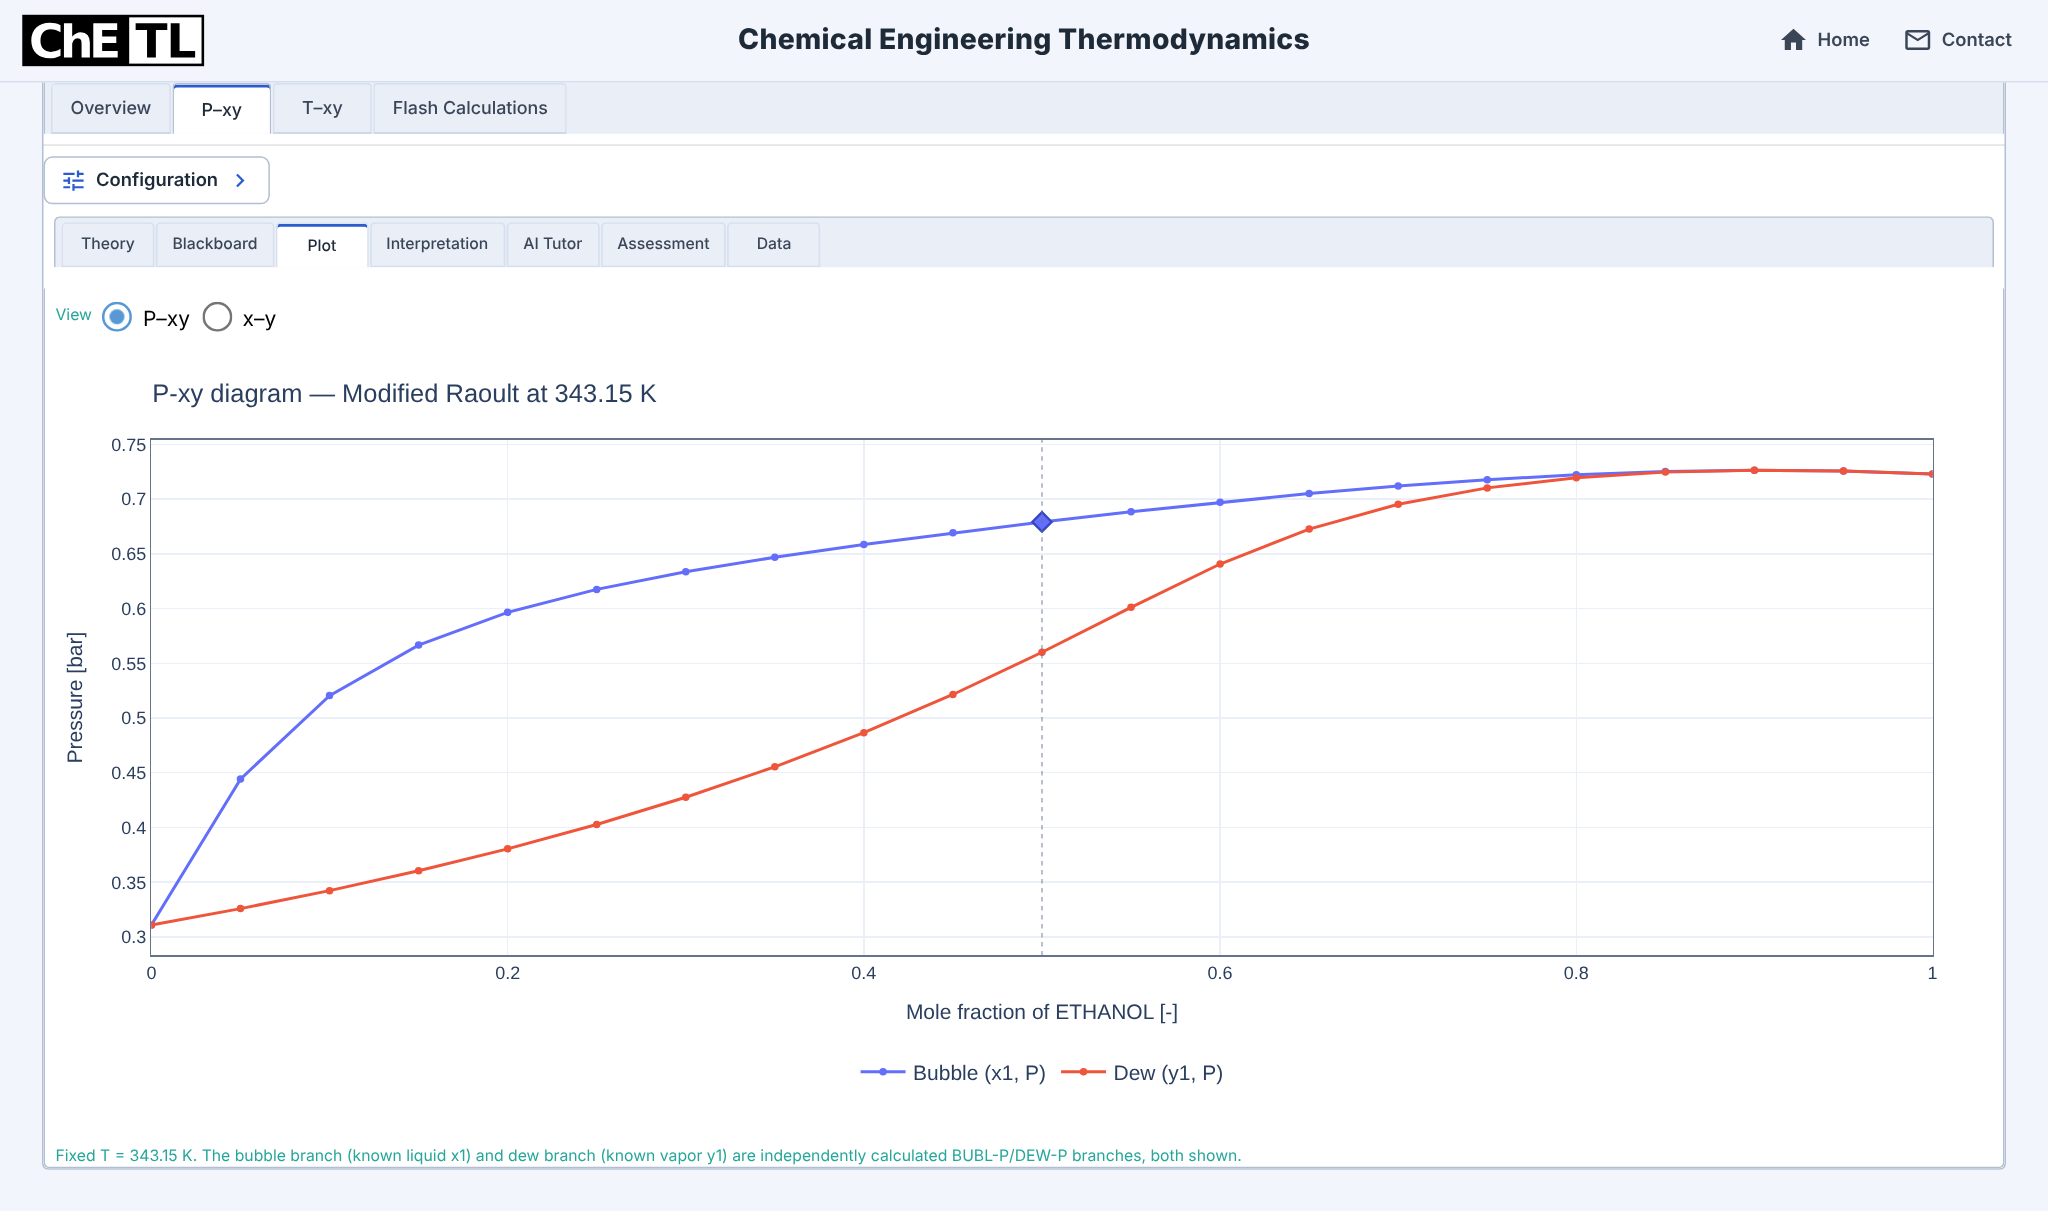
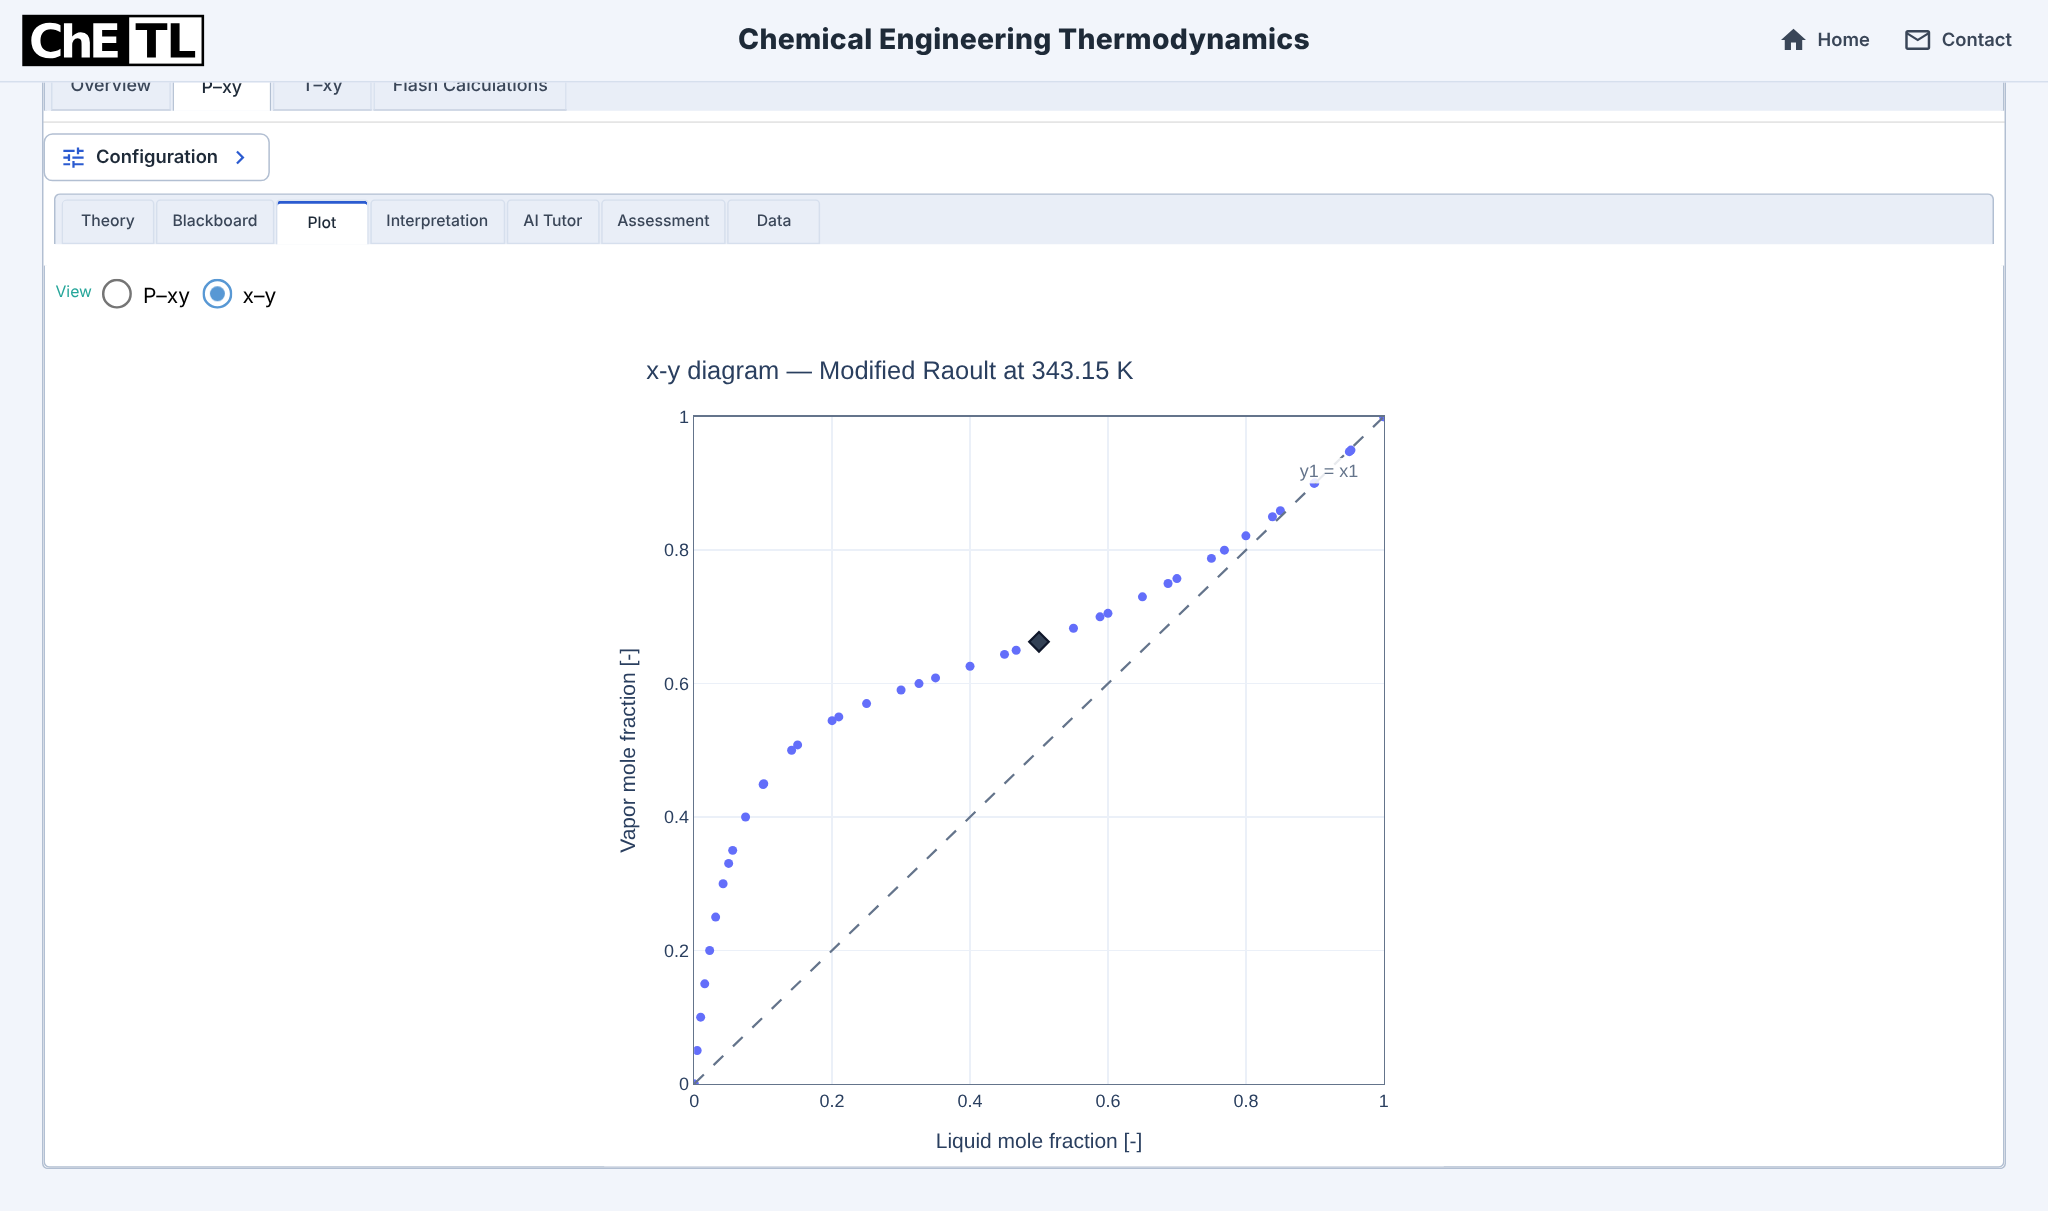
The 21-point bubble branch reaches a sampled pressure maximum of 0.7264 bar near x₁ = 0.90. That suggests azeotropic behaviour; this grid does not locate an exact azeotrope.
Explain enrichment and the model behind it.
Two successive views show every Interpretation card. The limits below keep those conclusions within the calculation’s scope.
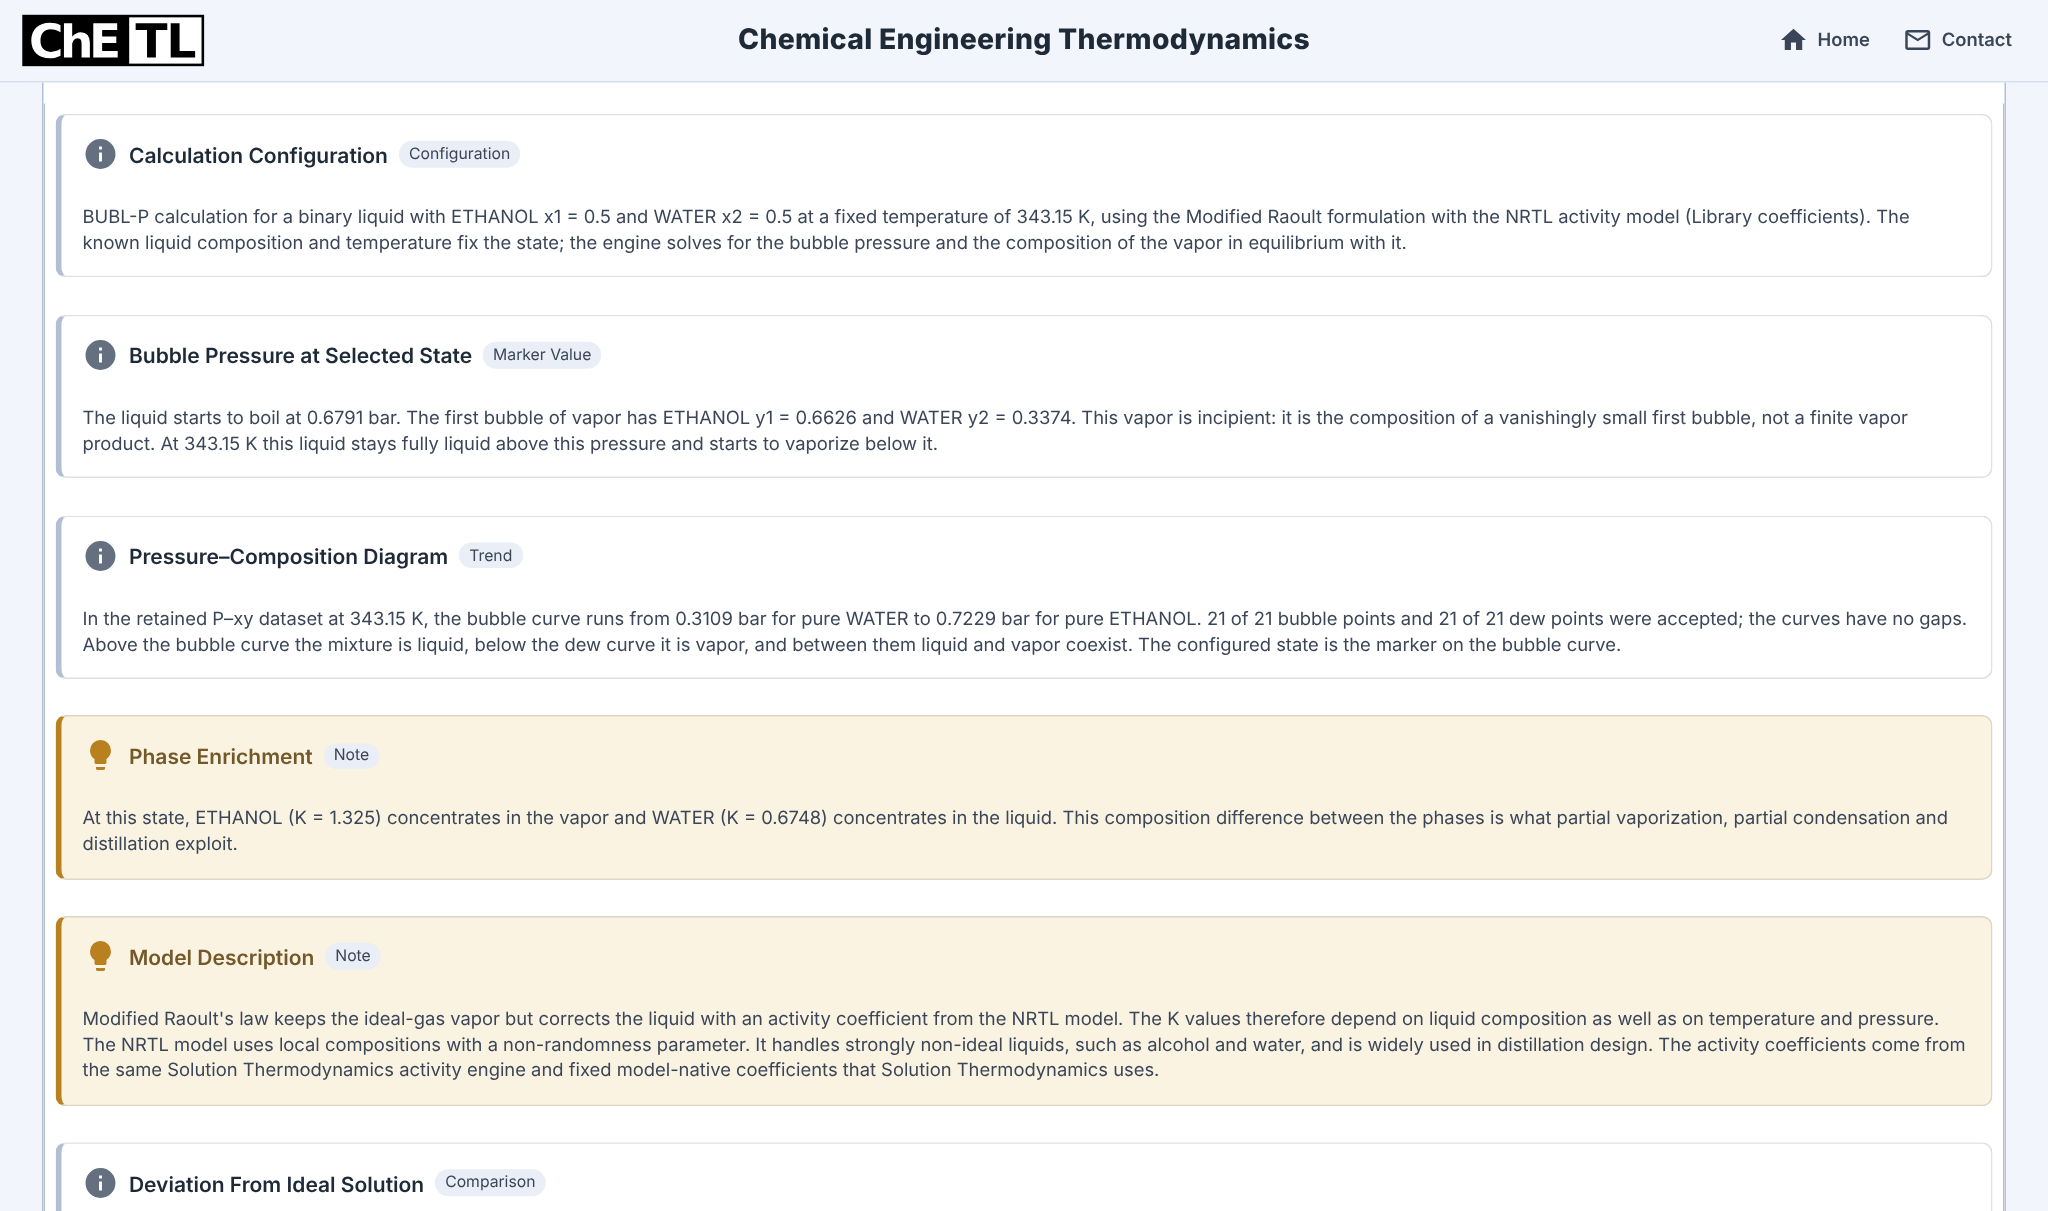
The first bubble, not a finite product
The first vapour contains about 66.26 mol% ethanol, compared with 50 mol% in the liquid. This is the composition of an infinitesimal bubble, not a vapour fraction or product flow.
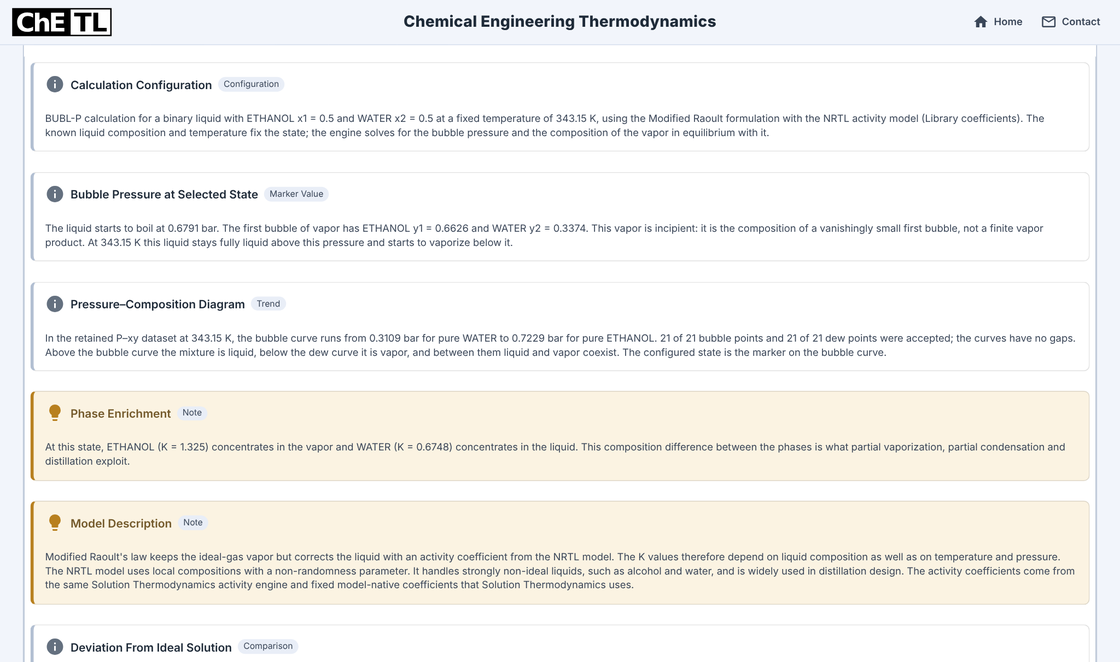
Interpretation: the configured state, diagram and enrichment. What NRTL changes, and where the result stops
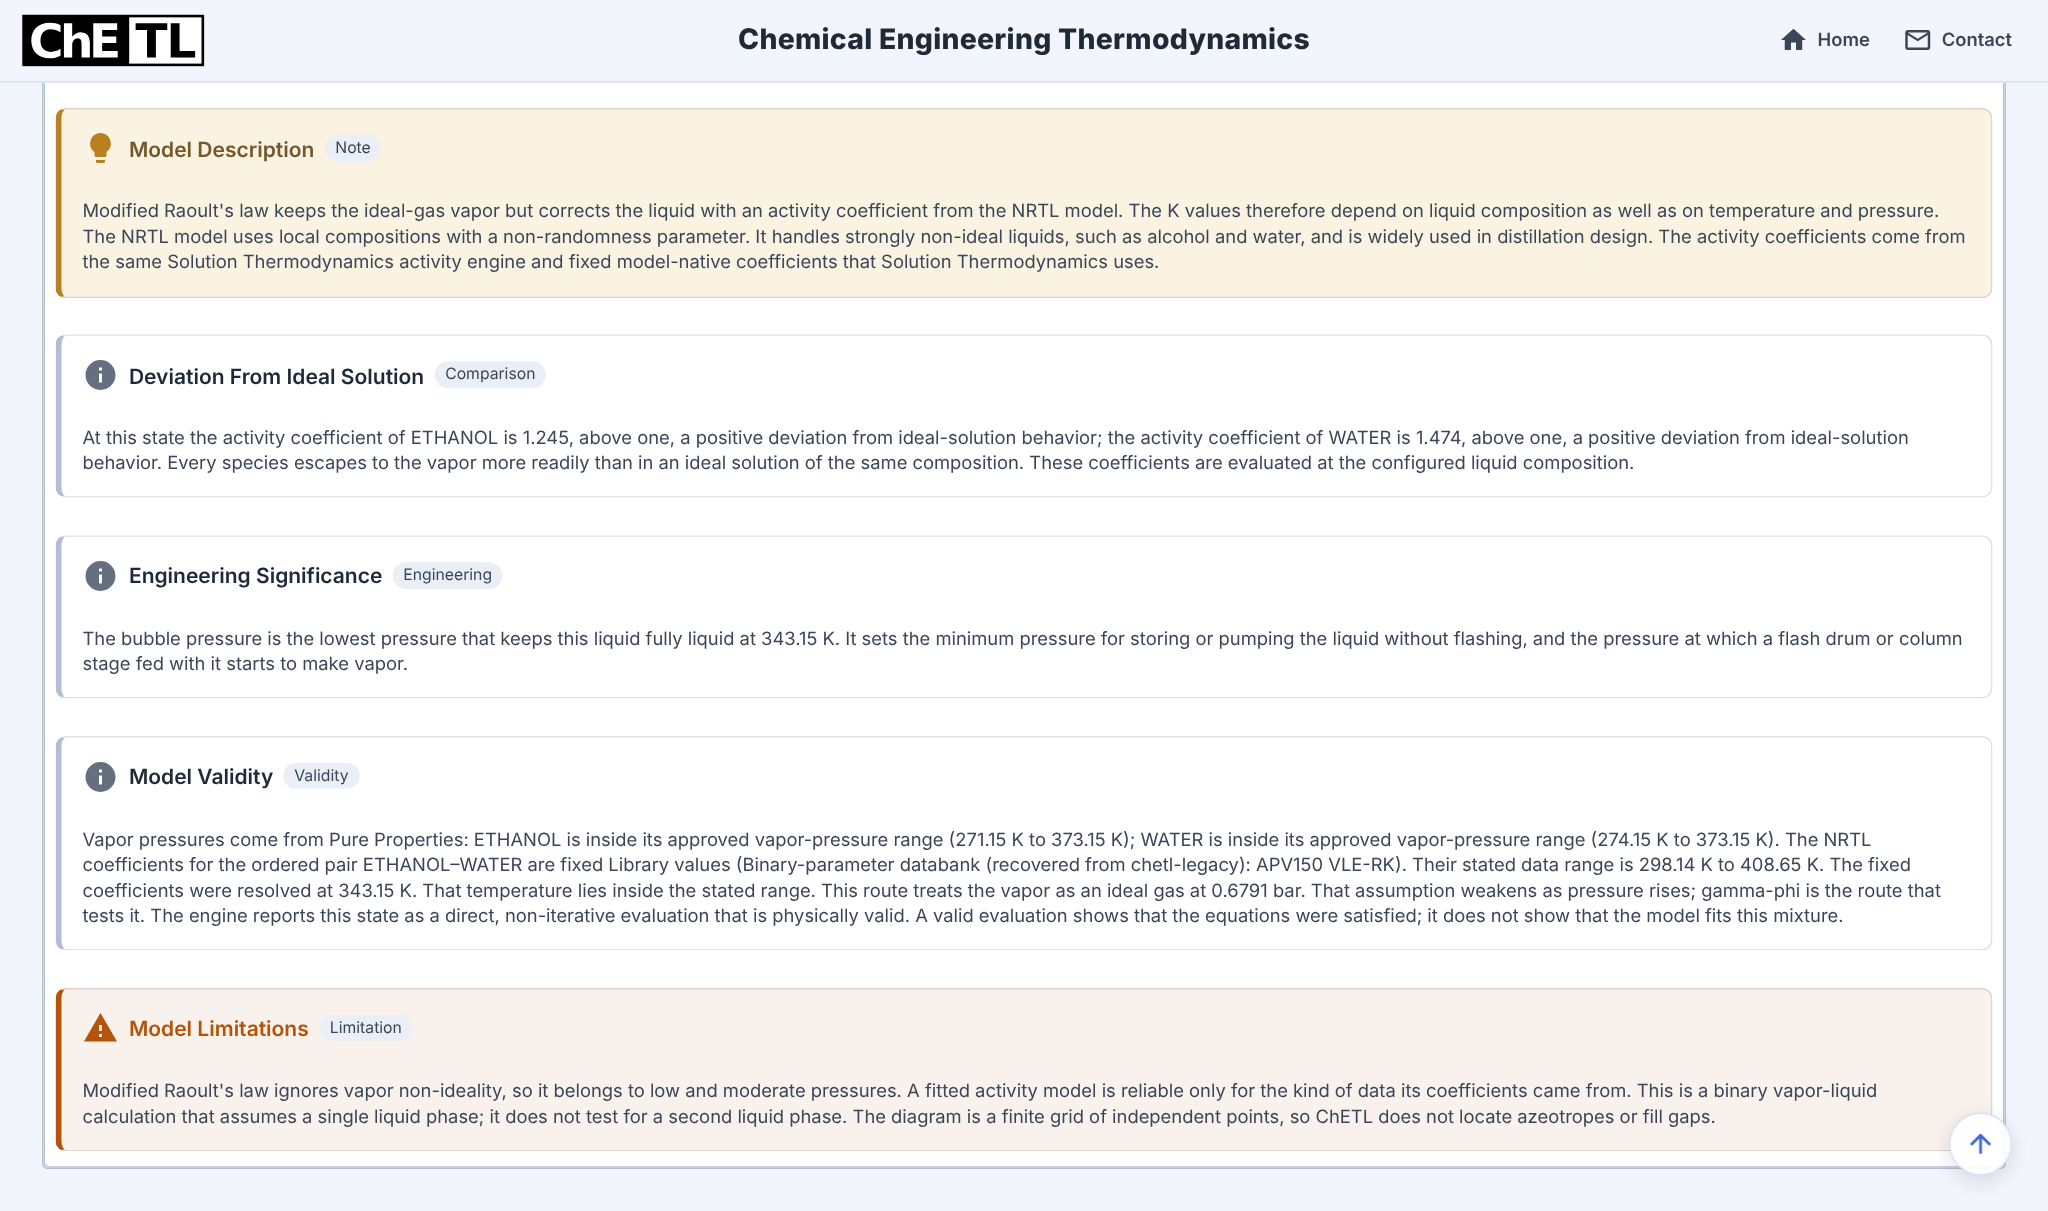
Both activity coefficients exceed one at this composition. NRTL accounts for liquid non-ideality while modified Raoult’s law retains the ideal-gas vapour assumption. The remaining cards state the engineering meaning, the parameter and vapour-pressure ranges, and the model limits. The bubble pressure is the thermodynamic boundary below which this liquid starts to vaporise; any operating margin above it is a separate engineering decision.
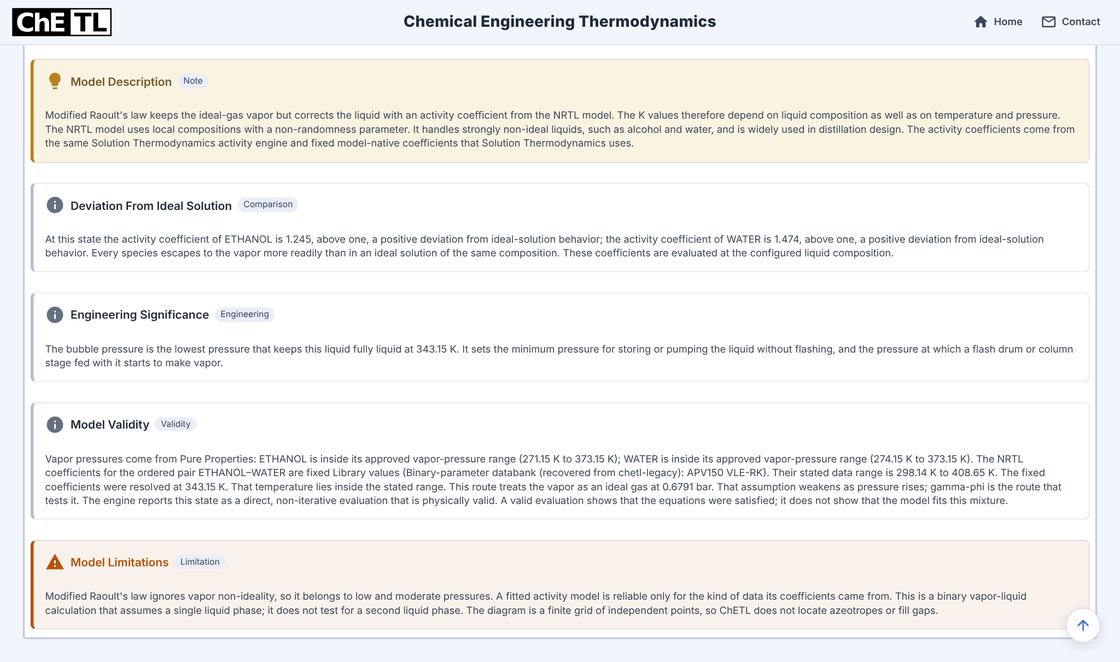
Interpretation: model, deviation, significance, validity and limitations.
Take the numbers with you.
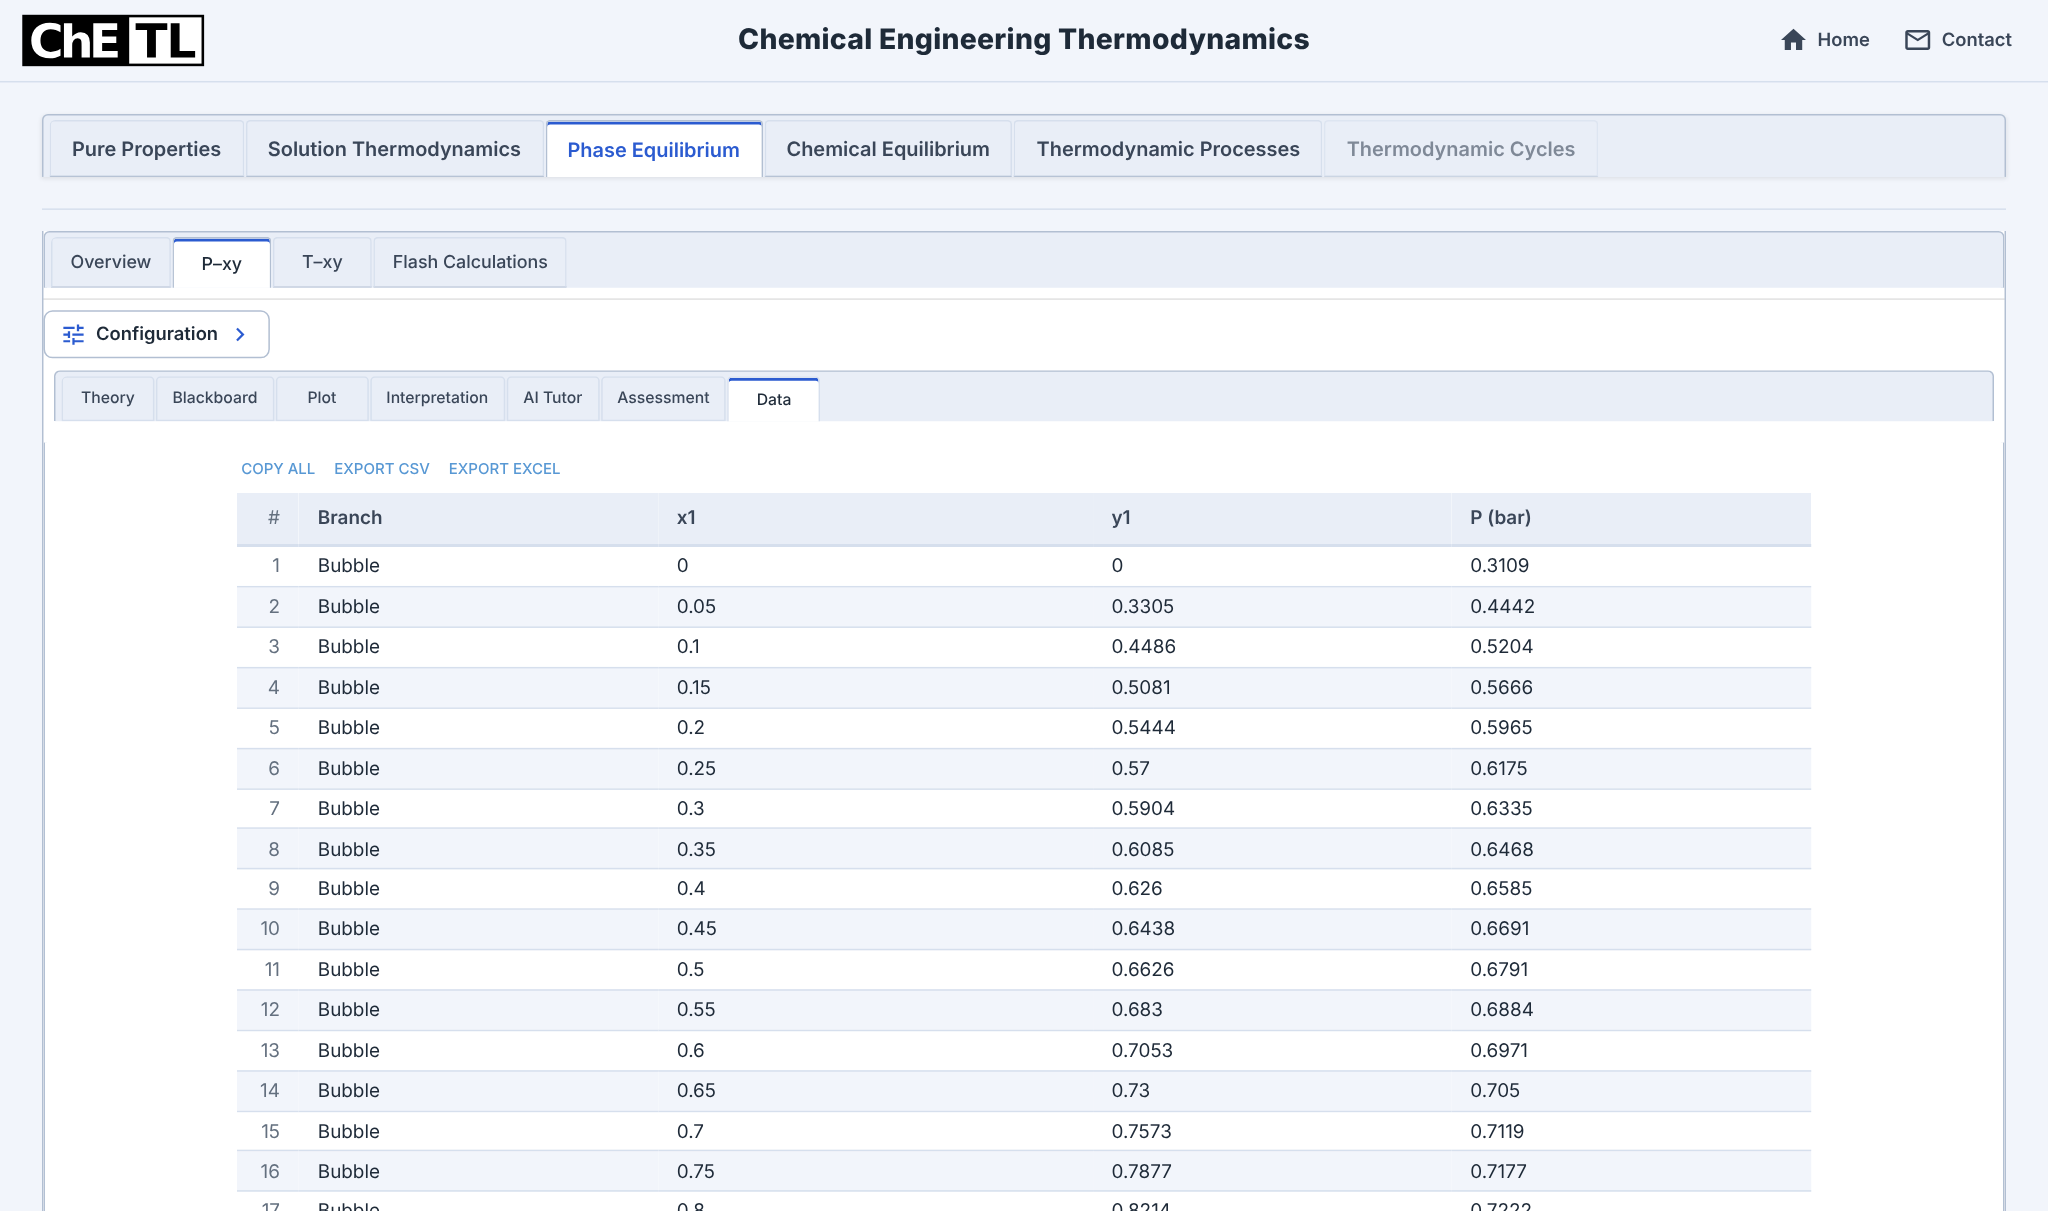
The Data tab contains 21 bubble and 21 dew states. Use them to reproduce the curves or compare another model.
Blackboard PDF · Plot data CSV (42 rows) · Vector plot SVG
Inspect the bubble-branch values
| x1 | y1 | P / bar |
|---|---|---|
| 0.00 | 0.0000 | 0.3109 |
| 0.05 | 0.3305 | 0.4442 |
| 0.10 | 0.4486 | 0.5204 |
| 0.15 | 0.5081 | 0.5666 |
| 0.20 | 0.5444 | 0.5965 |
| 0.25 | 0.5700 | 0.6175 |
| 0.30 | 0.5904 | 0.6335 |
| 0.35 | 0.6085 | 0.6468 |
| 0.40 | 0.6260 | 0.6585 |
| 0.45 | 0.6438 | 0.6691 |
| 0.50 | 0.6626 | 0.6791 |
| 0.55 | 0.6830 | 0.6884 |
| 0.60 | 0.7053 | 0.6971 |
| 0.65 | 0.7300 | 0.7050 |
| 0.70 | 0.7573 | 0.7119 |
| 0.75 | 0.7877 | 0.7177 |
| 0.80 | 0.8214 | 0.7222 |
| 0.85 | 0.8590 | 0.7251 |
| 0.90 | 0.9009 | 0.7264 |
| 0.95 | 0.9477 | 0.7257 |
| 1.00 | 1.0000 | 0.7229 |
Assumptions and limits
- Ideal-gas vapour and one liquid phase; no test for liquid–liquid separation.
- NRTL Library parameters and Antoine correlations are used within their stated temperature ranges. Satisfying the equations does not establish agreement with experimental data.
- The bubble pressure is a phase boundary, not a pump or storage design margin. Incipient vapour composition does not specify how much liquid vaporises.
- This fixed-temperature diagram has varying pressure. Column stages, reflux and duties require constant-pressure equilibrium information and the relevant balances and operating specifications.
Check your understanding
Show the answer and explanations
- Correct. y1 = K1x1, and K1 > 1 means y1 = 0.6626 > x1 = 0.5 for the first bubble at this state.
- Not supported. K values depend on composition. In the exported data, at x1 = 0.95 the computed y1 is 0.9477, slightly below x1, beyond the pressure maximum near x1 ≈ 0.9.
- Not supported. 0.6626 is the ethanol mole fraction of an incipient, vanishingly small vapour. How much liquid vaporises needs a flash calculation at a lower pressure.
- Not supported. This is a fixed-temperature diagram whose points are at different pressures. Stage counts need constant-pressure equilibrium data plus operating, material- and energy-balance specifications.
Sources and review
Unannotated snapshots were captured on 10 November 2026 from a local run of the current ChETL source with the settings shown in Set up. Each is a complete 1366 × 808 px viewport at one fixed scale, including the platform header; nothing was cropped, retouched or edited. The Blackboard PDF, CSV and vector plot retain the previously reviewed exports.
A separate Python calculation reproduces the selected state and all 42 exported equilibrium points from the source parameters (largest pressure difference below 10−8 bar). This AI-assisted check establishes numerical consistency, not experimental validation or human peer review.
Theory reference: Smith, Van Ness, Abbott and Swihart, Introduction to Chemical Engineering Thermodynamics, 9th ed., chapter 13. Editorial responsibility rests with the ChETL Scientific Editor.
Model parameters and property sources
Inputs and parameter provenance
The NRTL coefficients are those of the ChETL Library for ethanol(1)–water(2), α = 0.3, with T in kelvin. The recovered library source is APV150 VLE-RK, stated range 298.14–408.65 K; 343.15 K lies inside it. The library stores the pair in the opposite component order, so the coefficients below are already reordered. Source attribution is not a new experimental validation.
| Pair | a | b / K | τ at 343.15 K |
|---|---|---|---|
| τ12 | −0.9223 | 284.2856 | −0.0938 |
| τ21 | 3.622 | −636.726 | 1.7665 |
Saturation pressures use the Antoine form below. The constants are valid only with t in °C and pressure in mmHg, so the temperature is converted first and the result divided by 750.062 to give bar.
log10(Psat/mmHg) = A − B/(t/°C + C), t = T − 273.15, 1 bar = 750.062 mmHg
| Component | A | B | C | Valid range | Psat at 343.15 K |
|---|---|---|---|---|---|
| Ethanol | 8.1122 | 1592.86 | 226.18 | 271.15–373.15 K | 0.7229 bar |
| Water | 8.07131 | 1730.63 | 233.43 | 274.15–373.15 K | 0.3109 bar |
To try the case, sign in and enter the settings in Set up. Then change the temperature or composition and compare the views. Continue with the Phase Equilibrium guide or Thermodynamics in Aspen Plus.
Corrections: info@chetl.org.